Overview

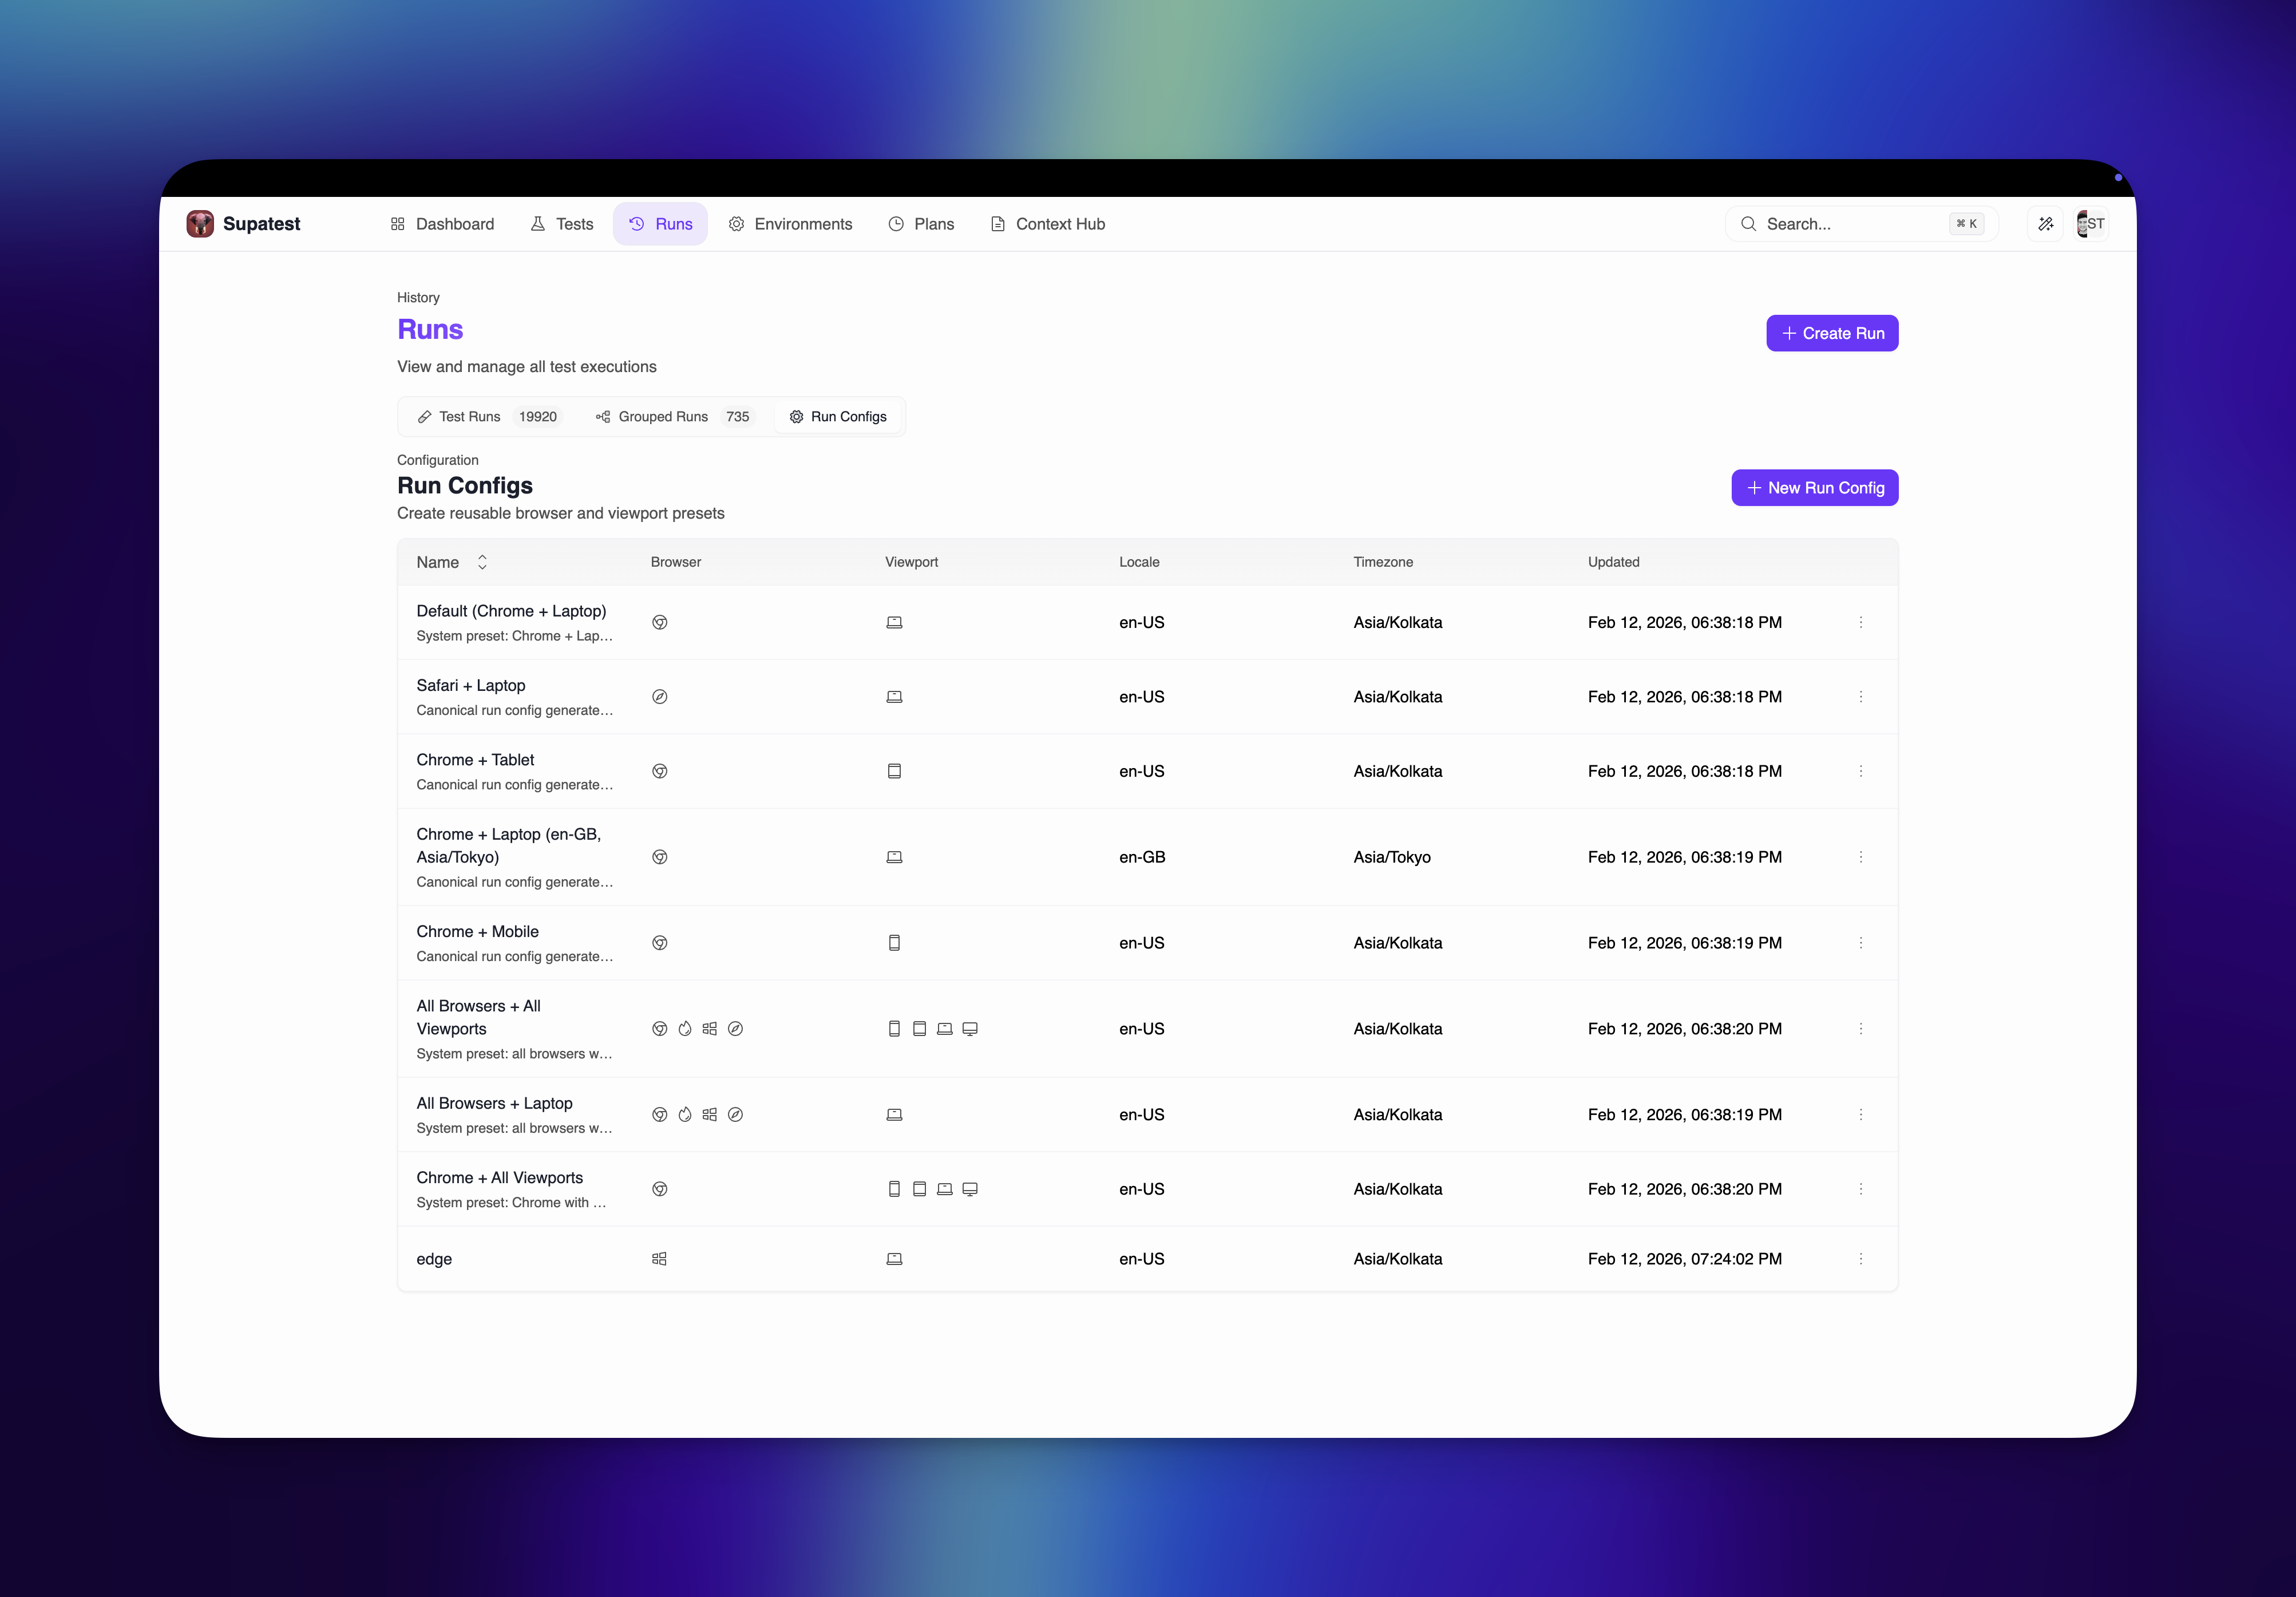
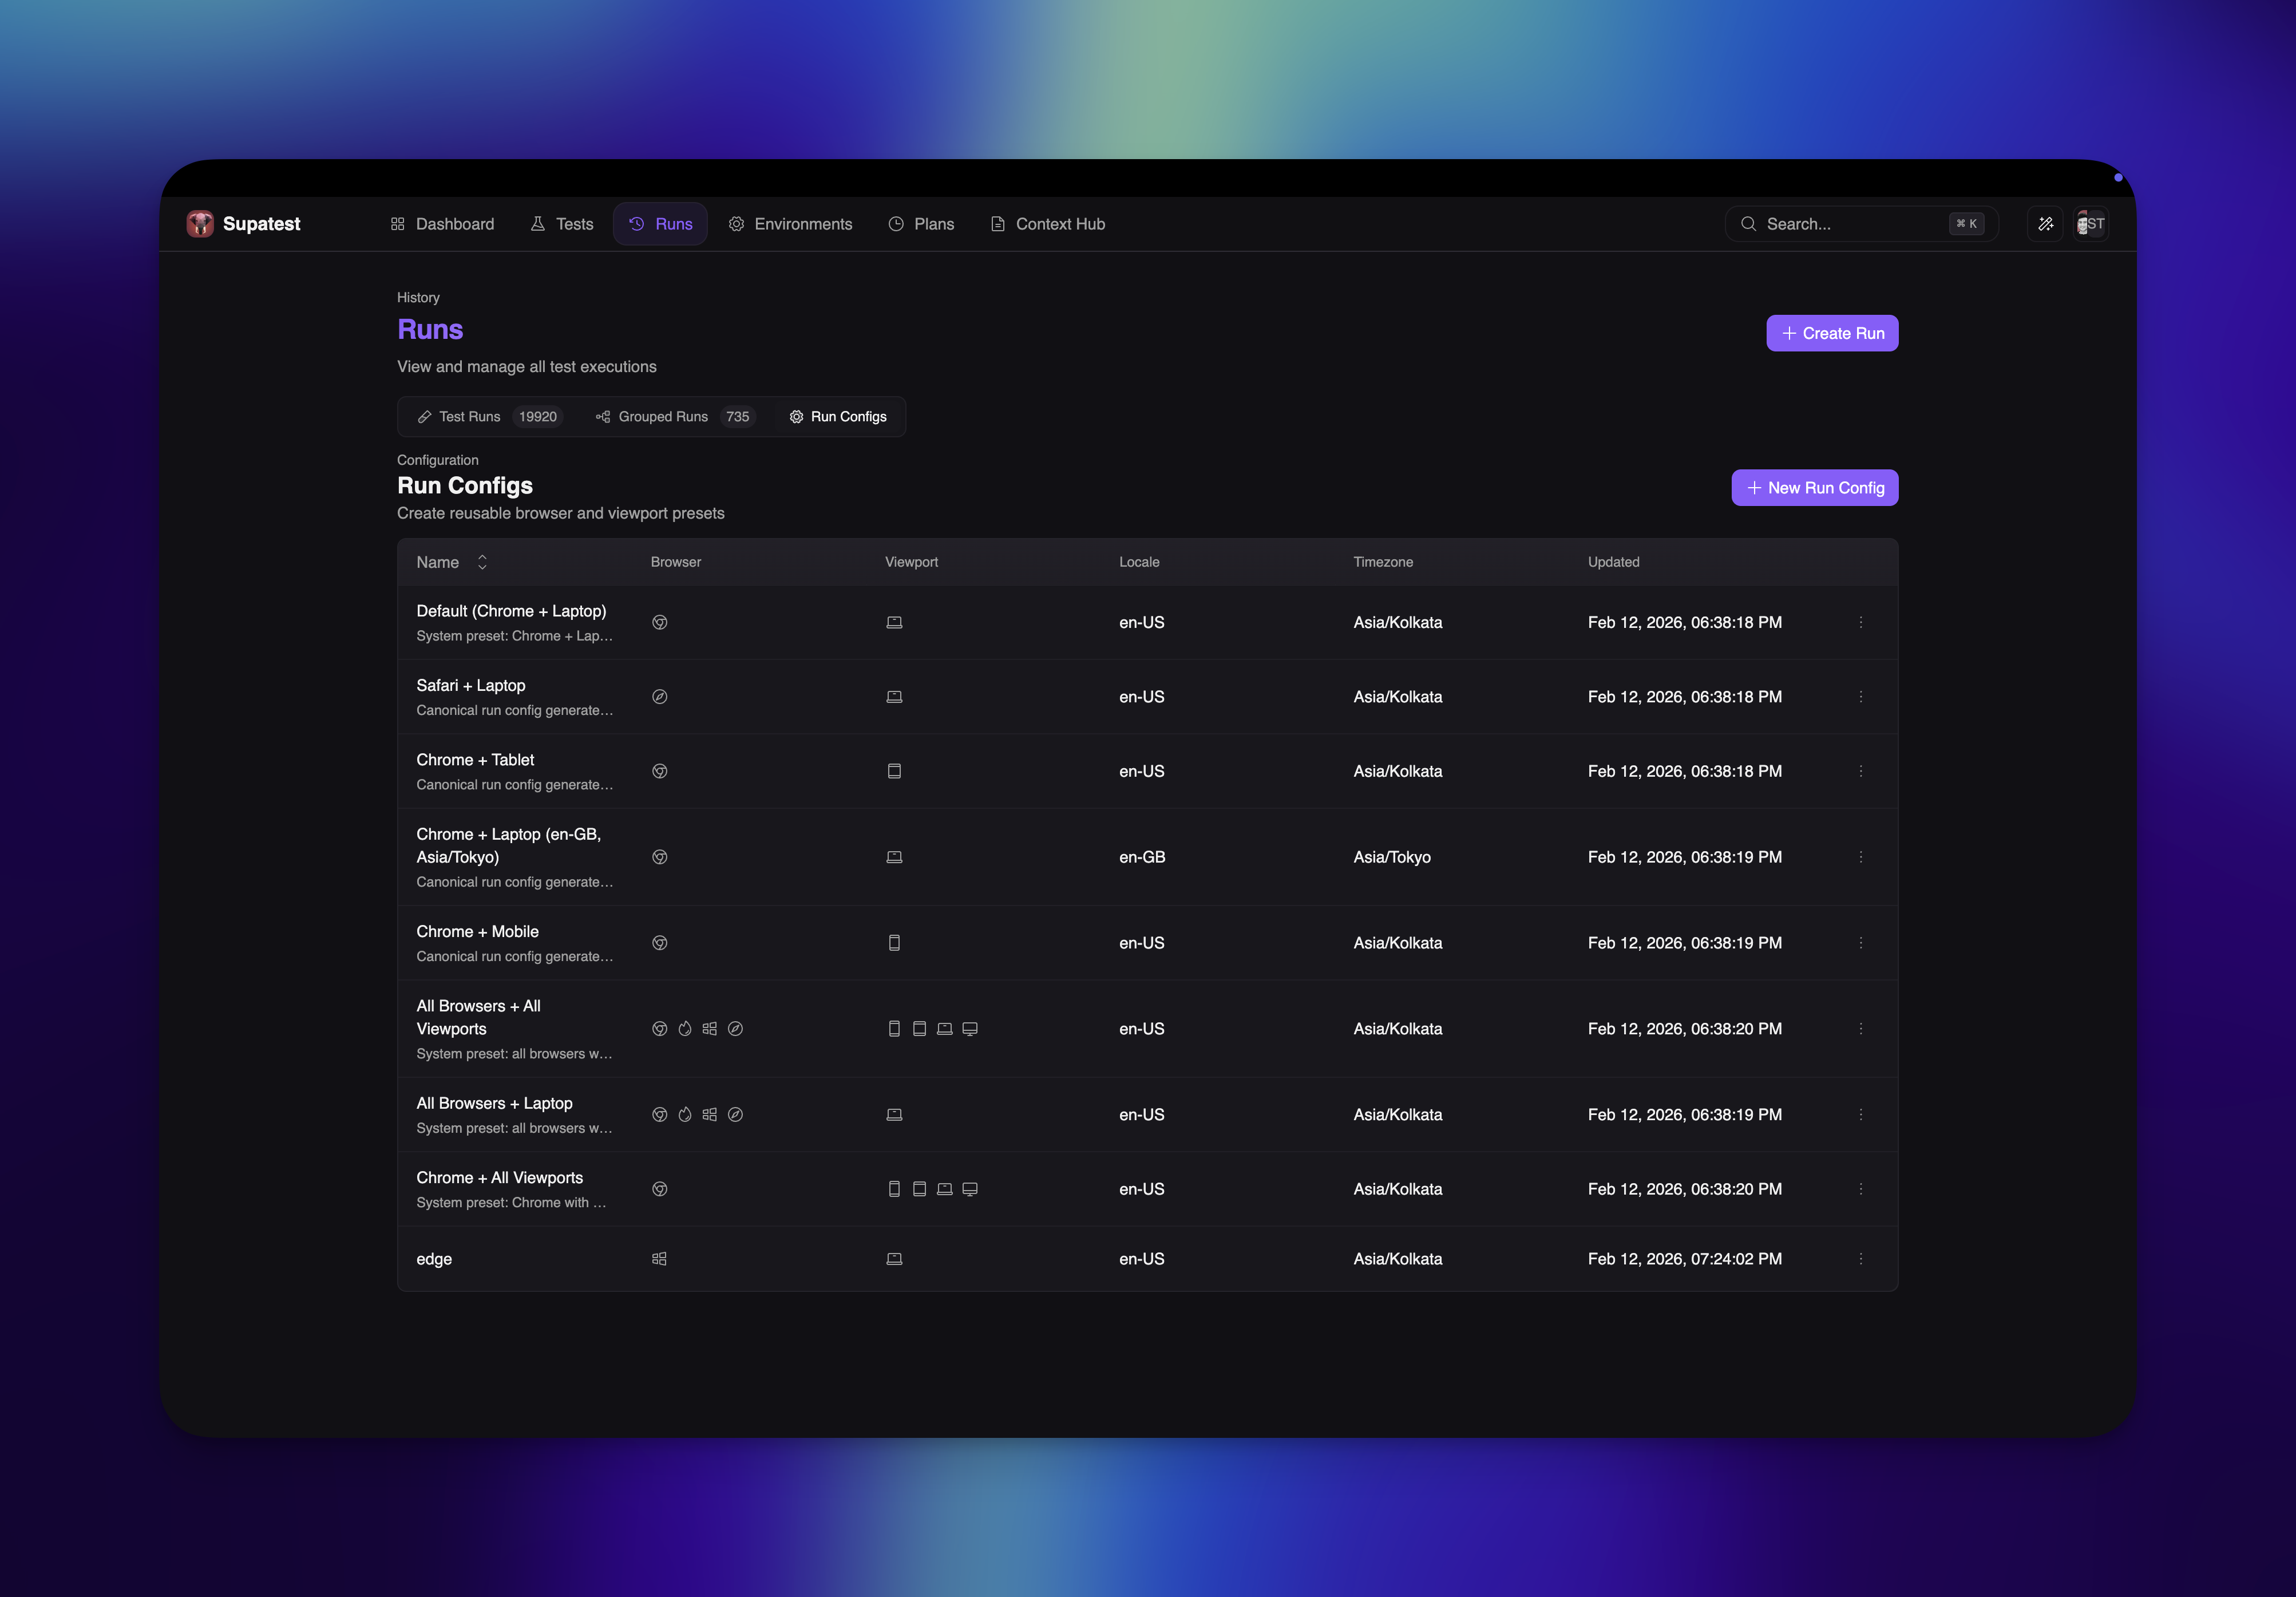
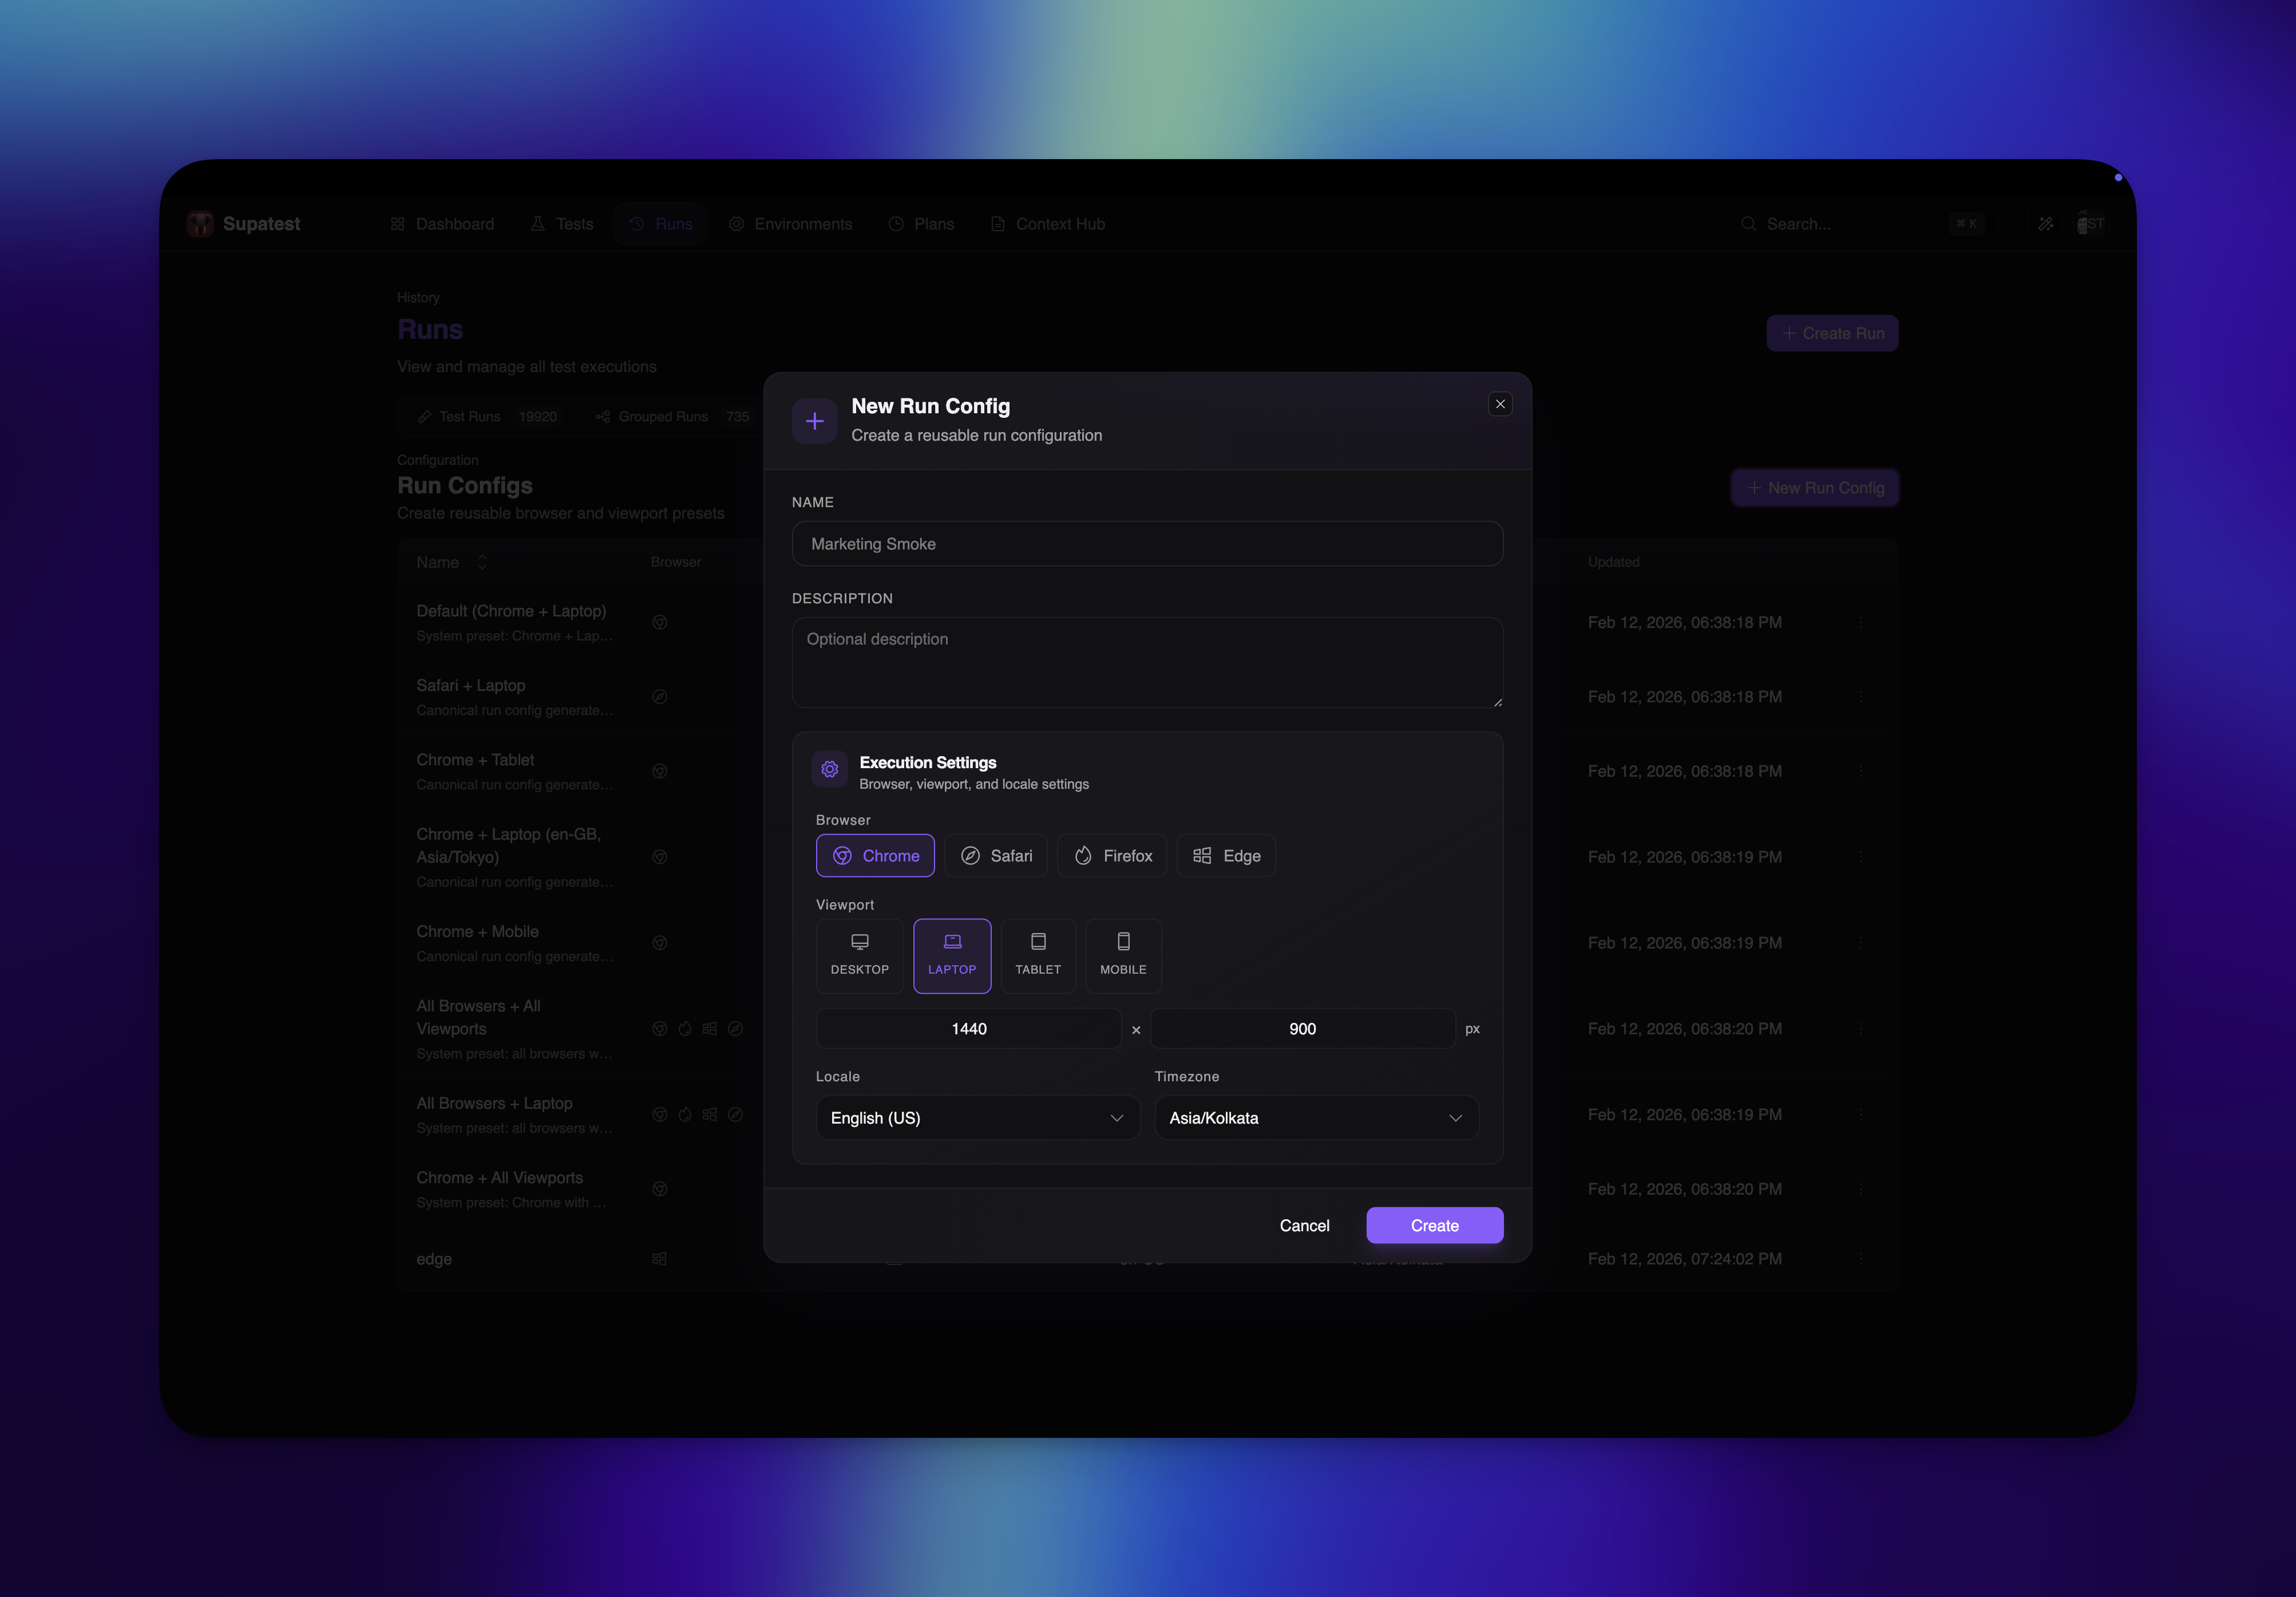
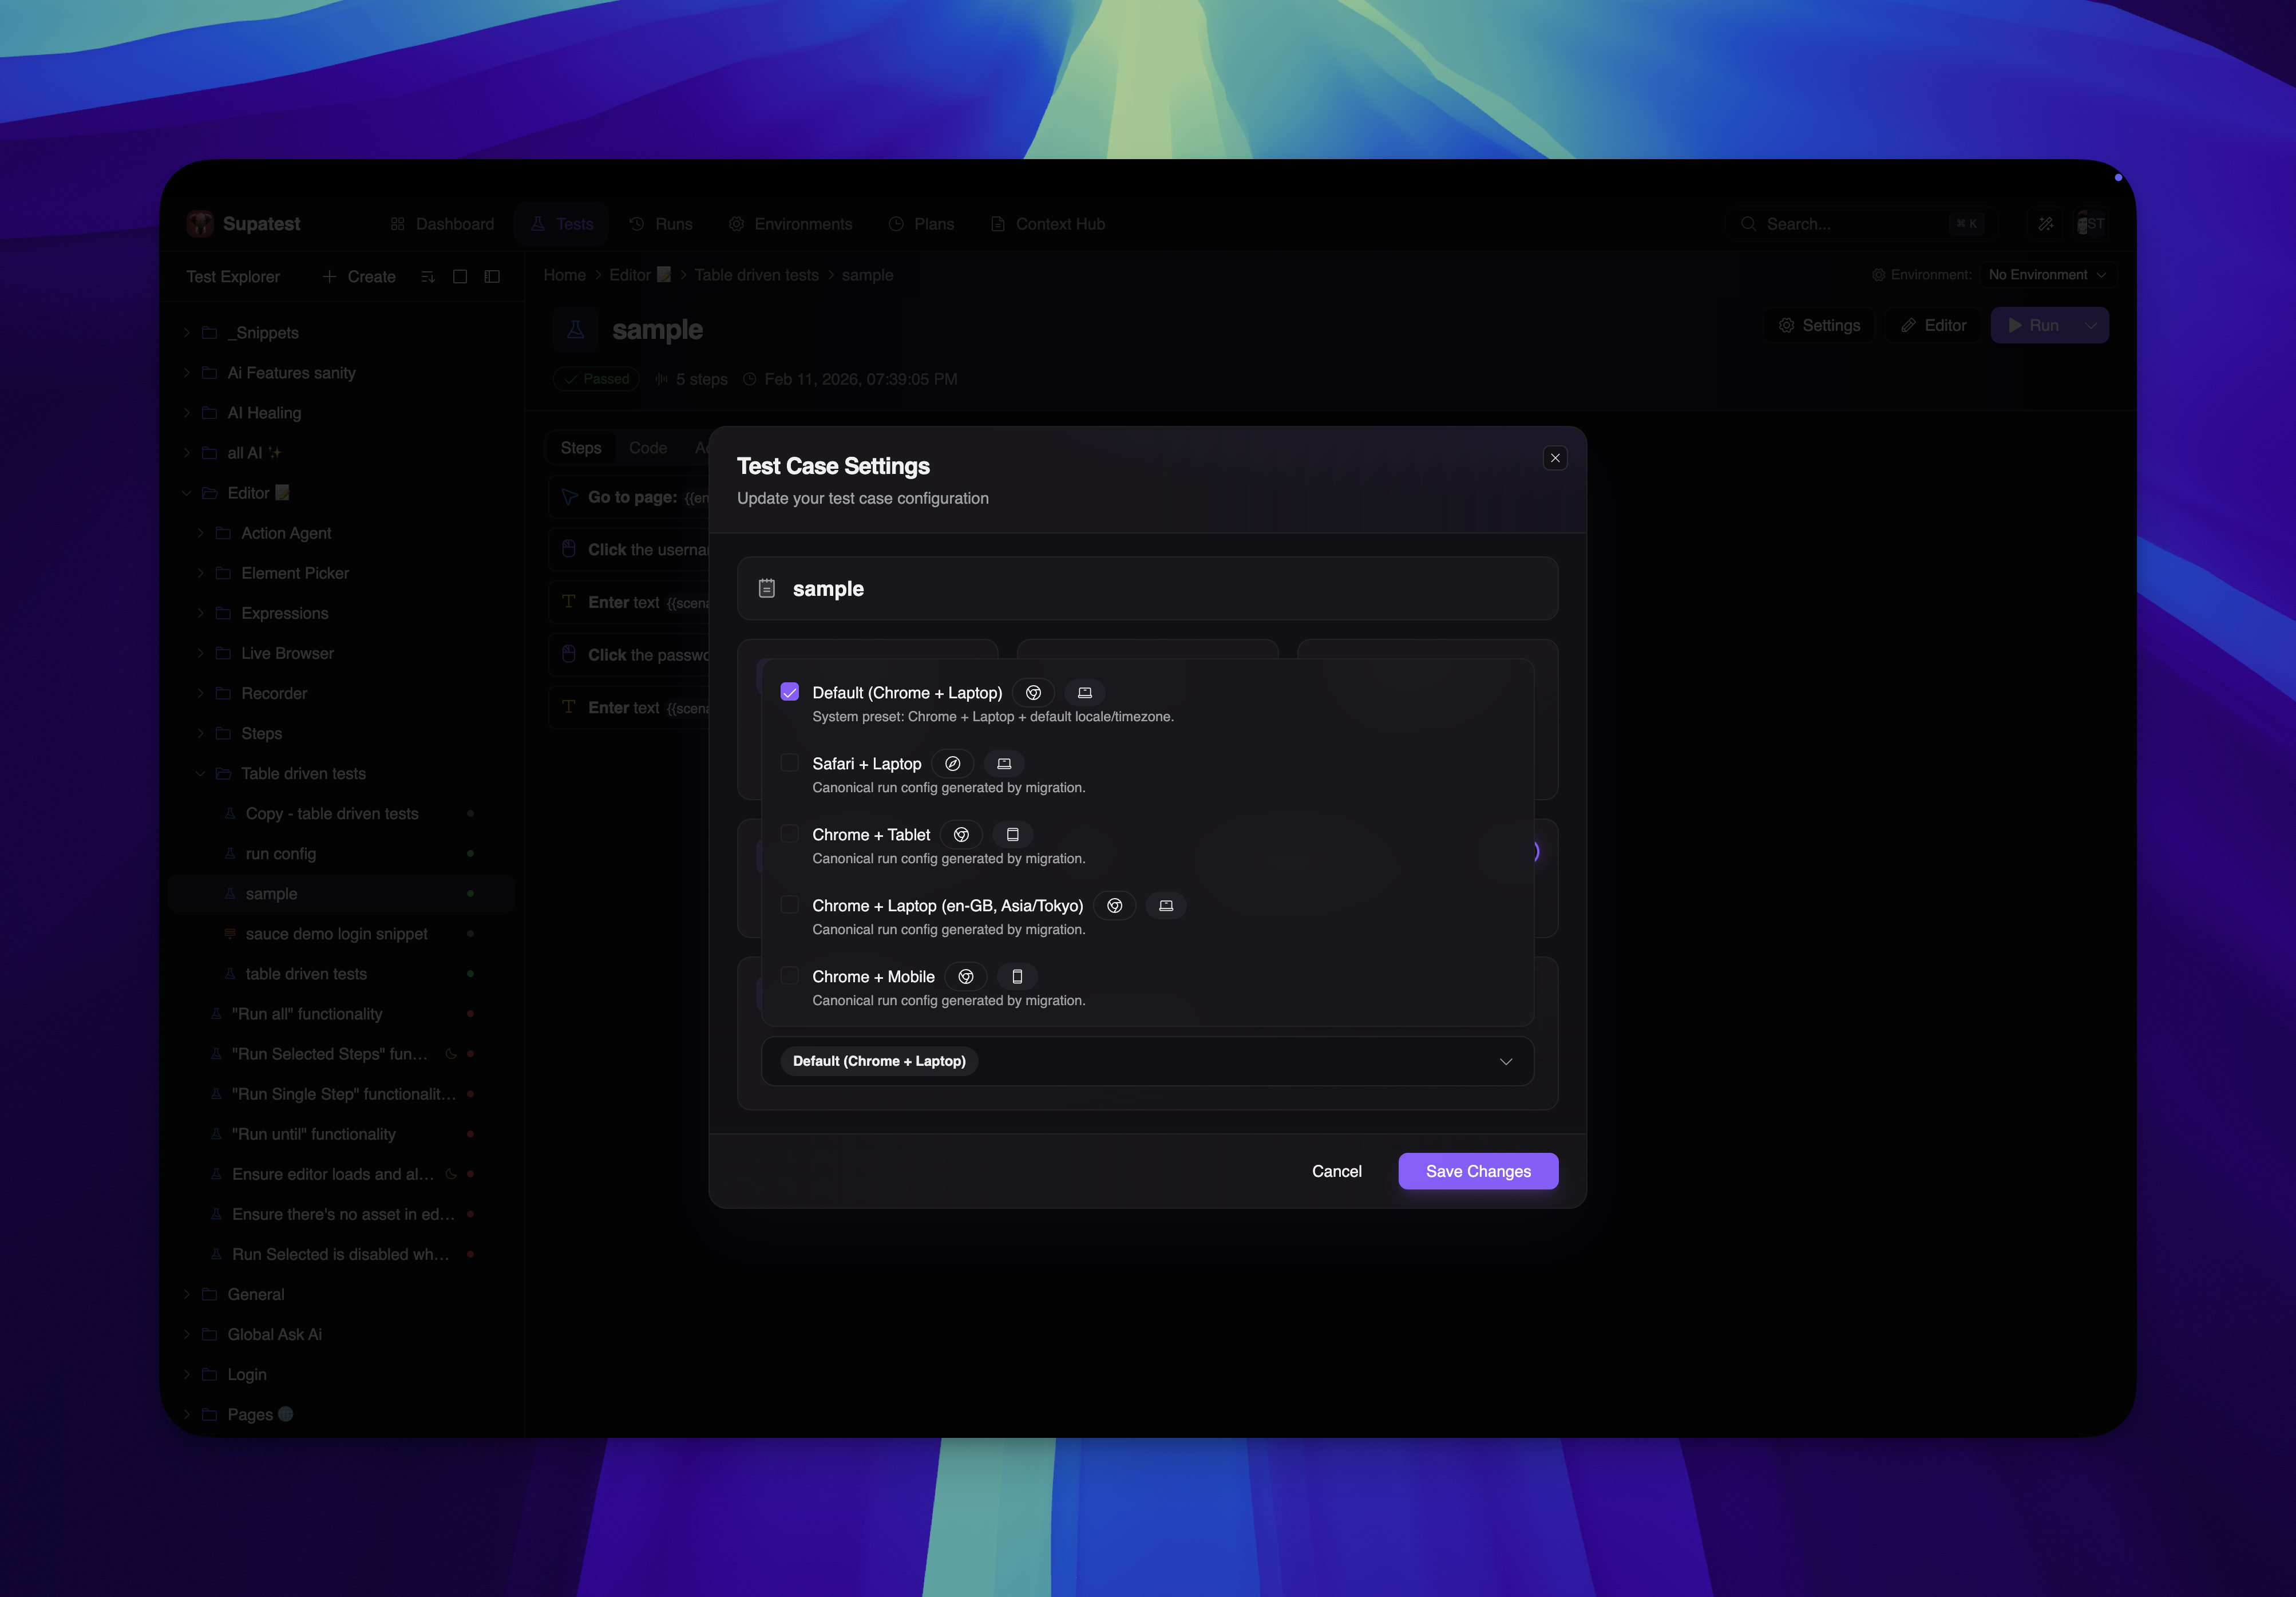
Test configuration controls how your tests execute. Configure browser type, viewport size, timeouts, and other settings to match your testing requirements. Settings can be applied at the test level, folder level, or globally.

Configuration Options

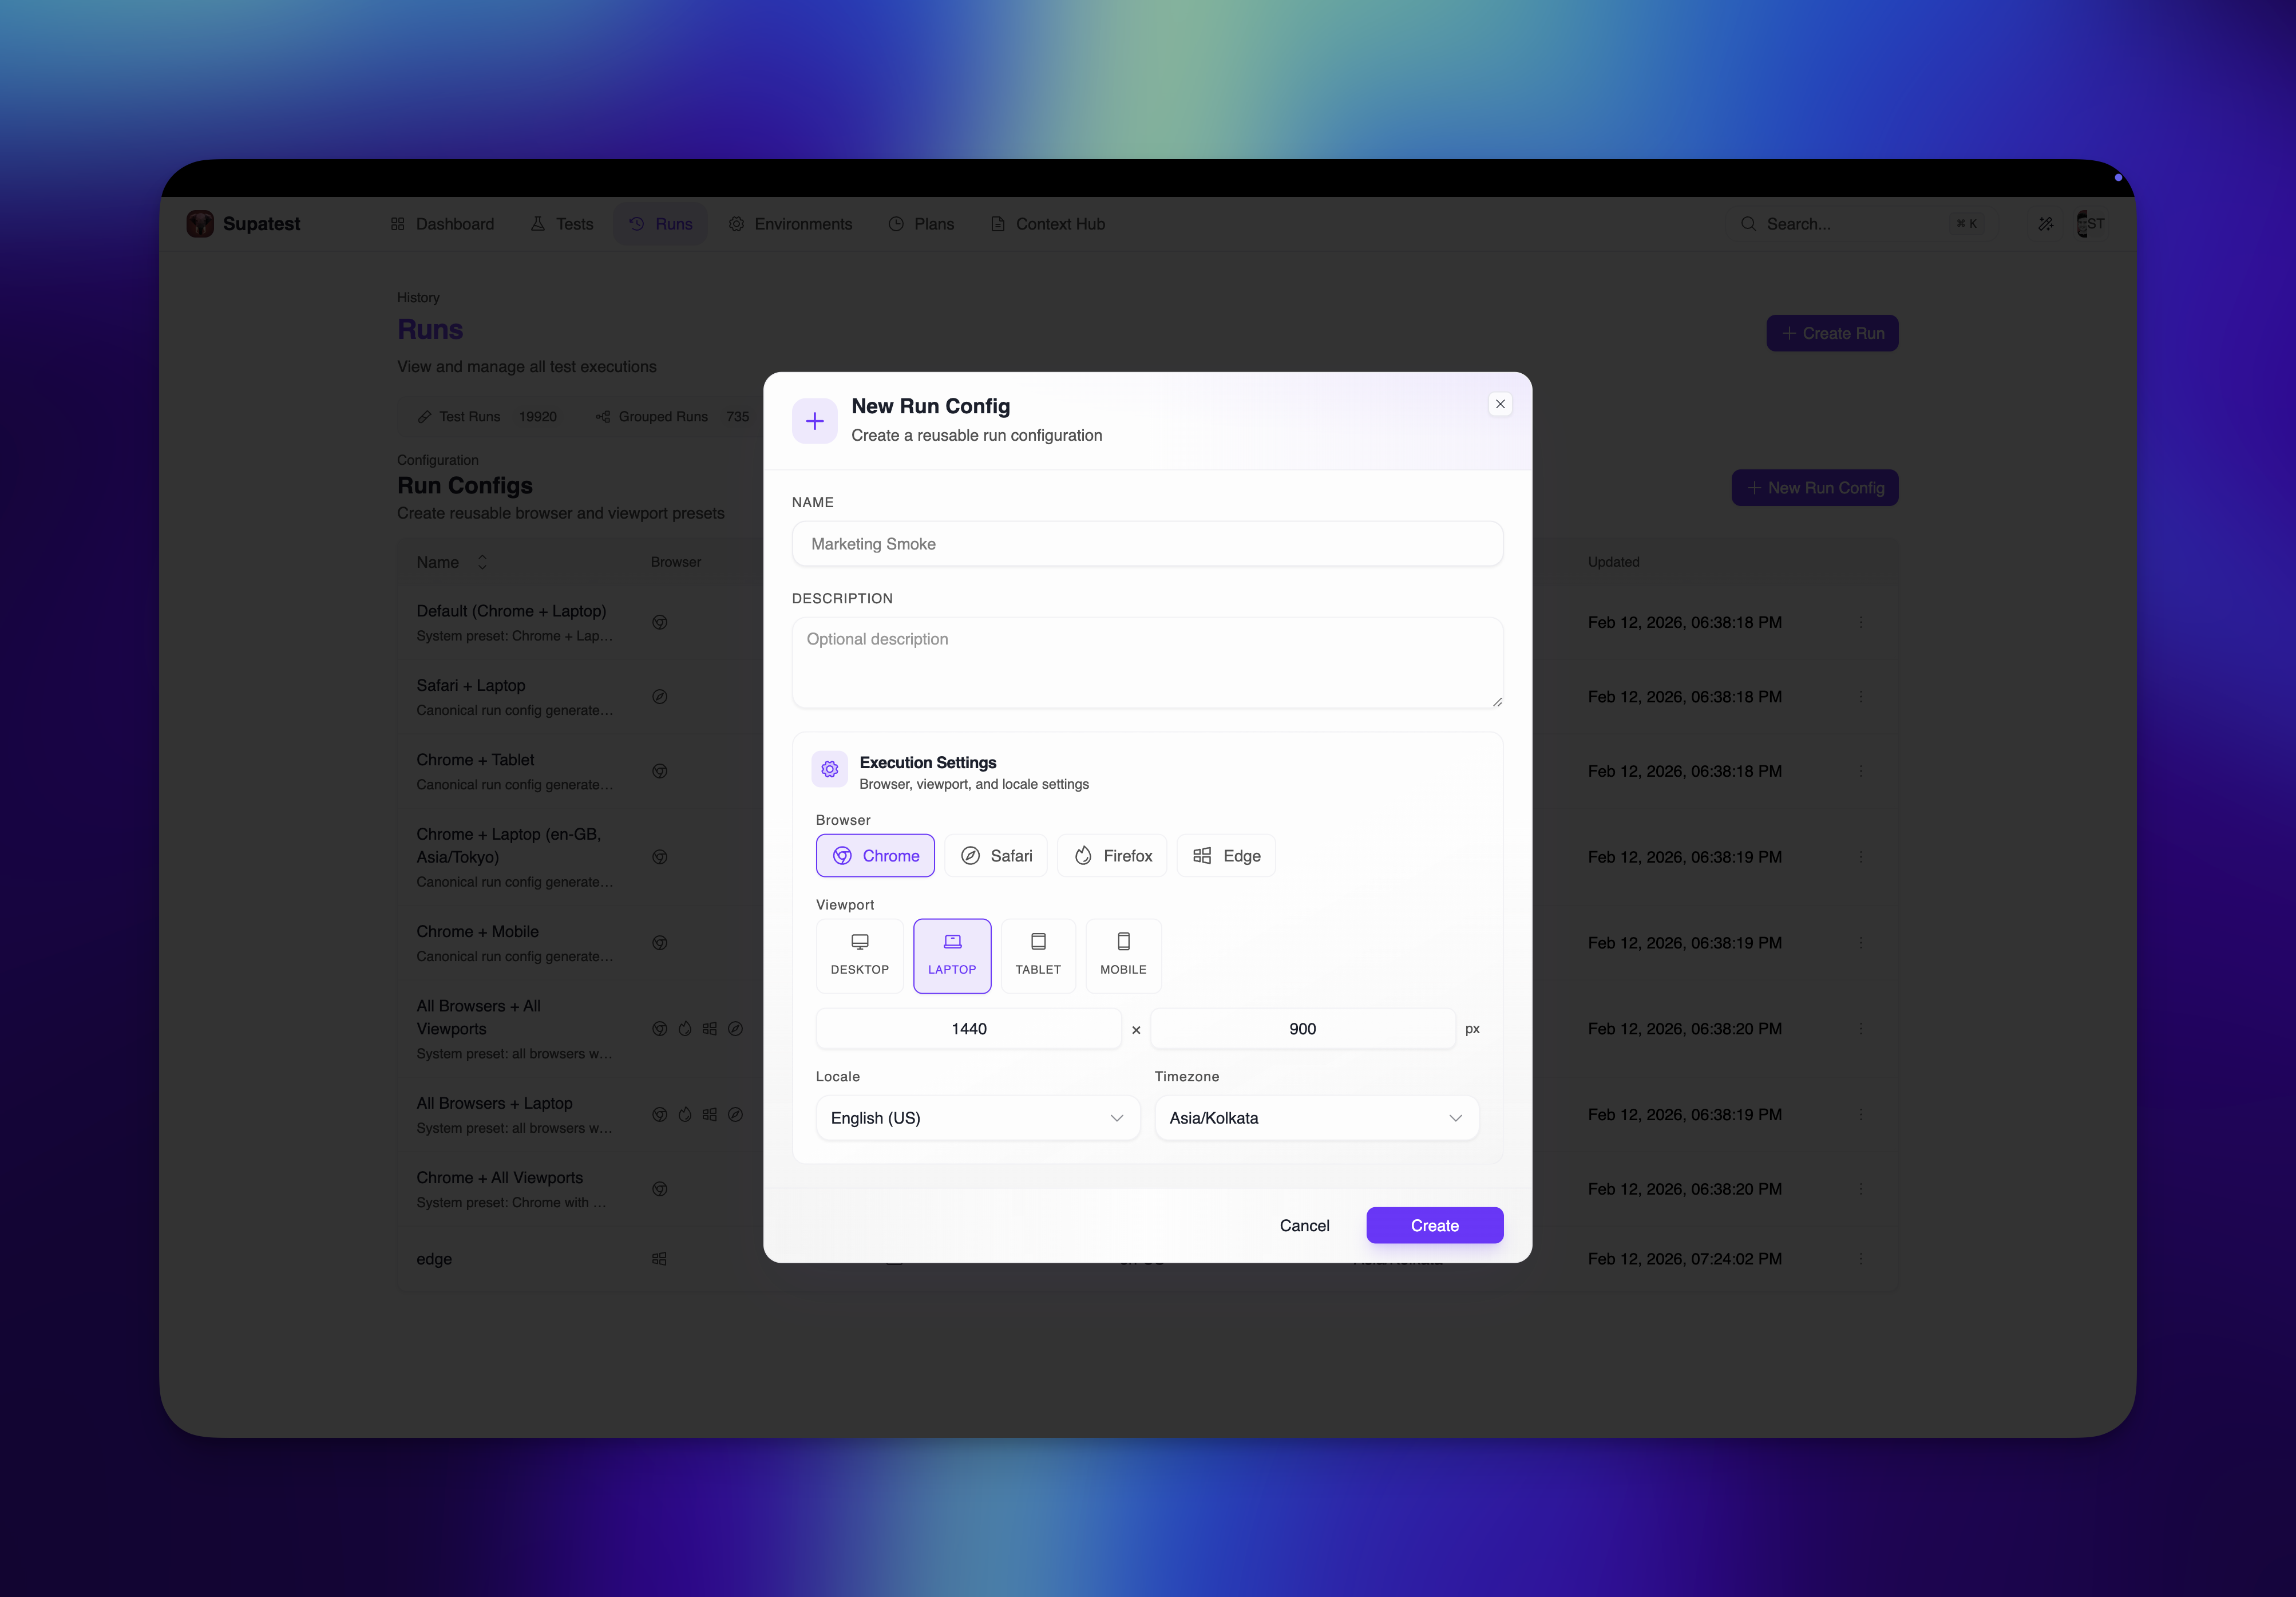
Browser Settings

Choose which browser runs your tests:
BrowserDescriptionBest For
ChromiumChrome-based browserMost web apps, default choice
FirefoxMozilla FirefoxCross-browser testing
WebKitSafari engineiOS/macOS compatibility
Setting the browser:
  1. Open test settings
  2. Select Browser dropdown
  3. Choose your browser
  4. Save changes

Viewport Configuration

Set the browser window size:
PresetDimensionsUse Case
Desktop1920x1080Standard desktop
Desktop HD1280x720Smaller desktop
Tablet768x1024iPad and tablets
Mobile375x667iPhone and mobile
CustomAnySpecific requirements
Setting viewport:
  1. Open test settings
  2. Find Viewport section
  3. Select preset or enter custom dimensions
  4. Save changes

Timeout Settings

Configure how long steps wait before failing:
Timeout TypeDefaultDescription
Step timeout10sMaximum time for each step
Navigation timeout30sMaximum time for page loads
Test timeout5minMaximum time for entire test
Adjusting timeouts:
  1. Open test settings
  2. Find Timeouts section
  3. Enter values in seconds/minutes
  4. Save changes
When to increase timeouts:
  • Slow network environments
  • Complex page loads
  • Long API responses
  • Heavy JavaScript applications

Auto-Healing

Enable automatic test repair when locators break:
SettingDescription
EnabledAI attempts to fix broken locators
DisabledTests fail on locator issues
How auto-healing works:
  1. Step fails due to locator not found
  2. System tries fallback locators
  3. If fallbacks fail, AI analyzes the page
  4. AI finds correct element and continues
  5. Healing suggestion saved for review
Learn more about Auto-Healing →

Run Configuration

Control execution behavior:
OptionDescription
HeadlessRun without visible browser
Video recordingCapture execution video
ScreenshotsCapture step screenshots
Trace captureRecord detailed trace

Applying Settings

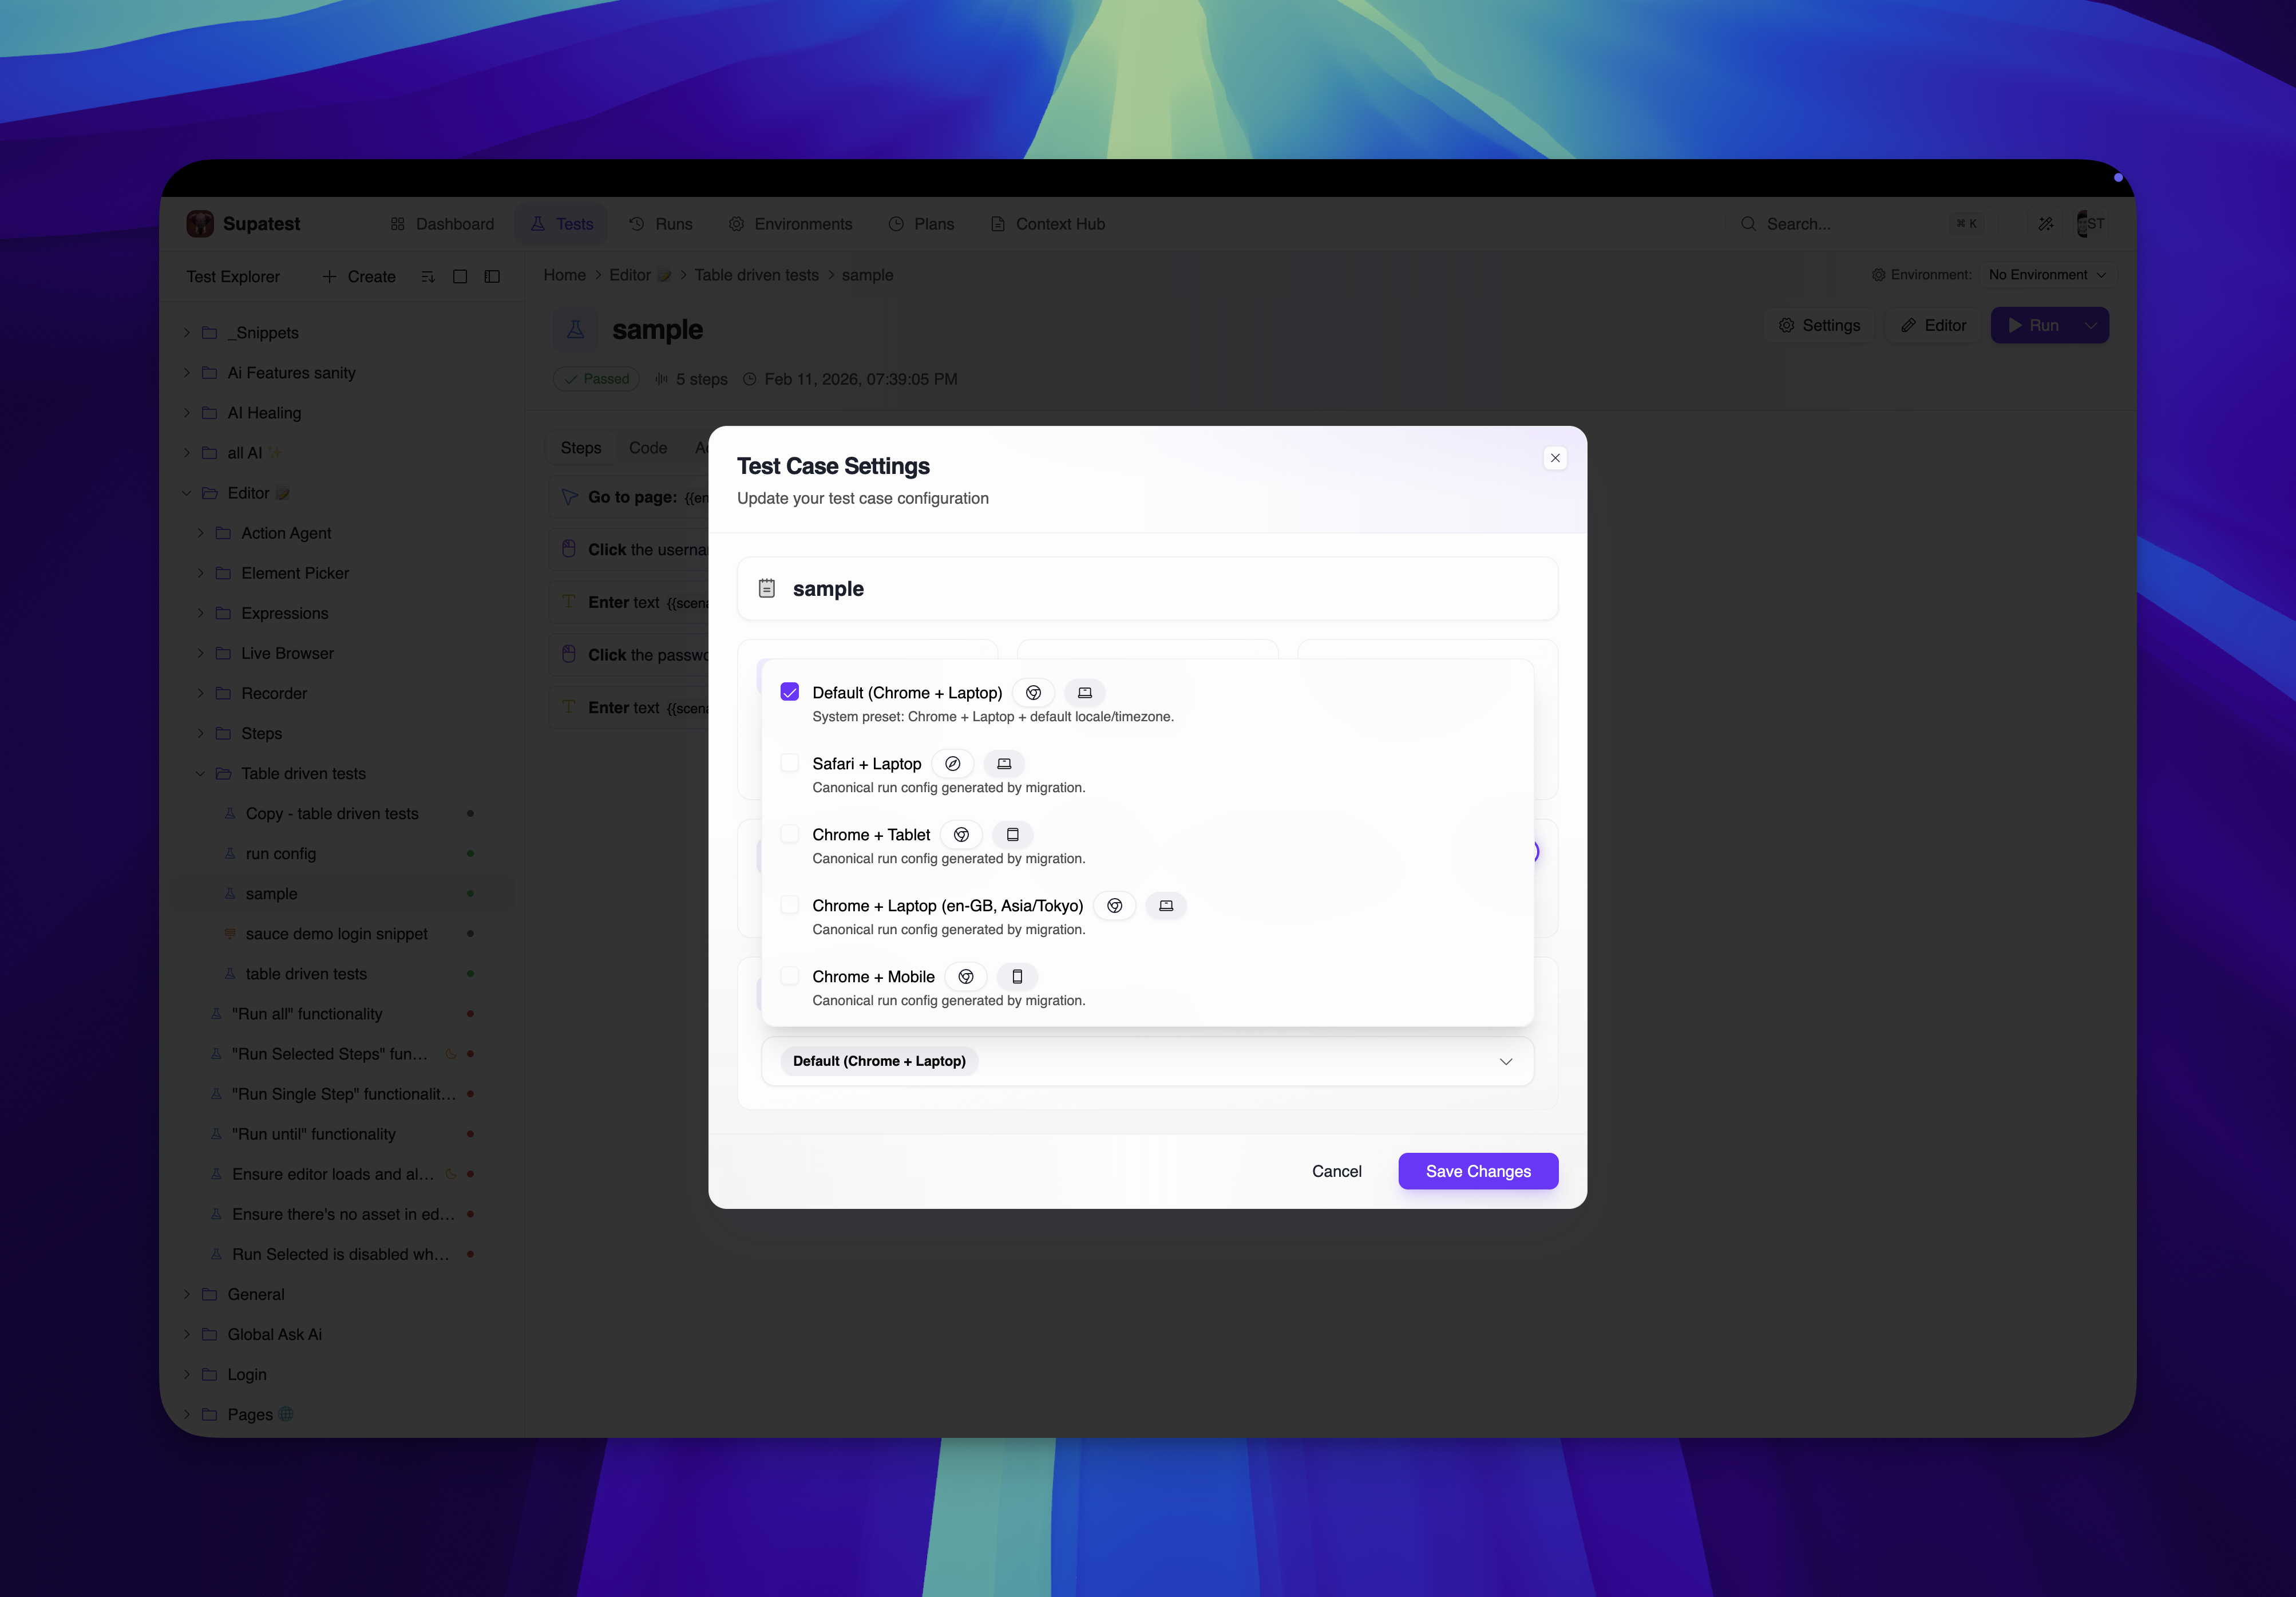
Test-Level Settings

Configure individual tests:
  1. Open the test case
  2. Click Settings tab or gear icon
  3. Modify settings
  4. Save changes
Settings apply only to this test.

Environment-Level Settings

Set defaults per environment:
  1. Go to Environments
  2. Select an environment
  3. Configure default settings
  4. Tests inherit these when run in this environment

Organization Settings

Set global defaults:
  1. Go to Settings > Organization
  2. Configure default test settings
  3. All new tests inherit these defaults

Settings Priority

Settings cascade with this priority:
1. Test-level (highest priority)
2. Environment-level
3. Organization-level (lowest priority)
More specific settings override general ones.

Common Configurations

Mobile Testing

Viewport: 375 x 667 (Mobile)
Browser: Chromium
User Agent: Mobile Chrome

Slow Application Testing

Step Timeout: 30 seconds
Navigation Timeout: 60 seconds
Test Timeout: 10 minutes

Cross-Browser Testing

Create multiple test runs with different browsers:
Run 1: Chromium
Run 2: Firefox
Run 3: WebKit

CI/CD Optimized

Headless: Yes
Video: On failure only
Screenshots: On failure only
Trace: Disabled

Debug Configuration

Headless: No
Video: Always
Screenshots: Always
Trace: Enabled
Timeout: Extended

Video Recording

Recording Options

OptionDescription
AlwaysRecord every run
On failureRecord only failed runs
NeverNo video recording

Accessing Recordings

  1. Open the test case and go to the Last Run Report tab (or open a specific run from the Runs tab)
  2. Click the Video sub-tab
  3. Play or download recording

Video Best Practices

  • Use “On failure” for CI to save storage
  • Use “Always” for debugging sessions
  • Videos help diagnose visual/timing issues

Screenshot Capture

Screenshot Options

OptionDescription
Every stepCapture after each step
On failureCapture only at failure point
DisabledNo screenshots

Viewing Screenshots

  1. Open the test case and go to the Last Run Report tab (or open a specific run from the Runs tab)
  2. Click the Screenshots sub-tab
  3. Navigate step-by-step images

Screenshot Tips

  • Step screenshots help identify where issues started
  • Compare screenshots across runs
  • Use for visual regression checks

Trace Files

What Traces Capture

  • Network requests and responses
  • DOM snapshots at each action
  • Console messages
  • Action timing details
  • Browser events

Using Traces

  1. Open the test case and go to the Last Run Report tab (or open a specific run from the Runs tab)
  2. Click the Trace sub-tab
  3. Open in Trace Viewer
  4. Navigate timeline and inspect actions

When to Use Traces

  • Debugging intermittent failures
  • Investigating timing issues
  • Analyzing network behavior
  • Understanding step execution

Advanced Settings

Custom Headers

Add custom HTTP headers:
Headers:
  - Authorization: Bearer {{ env.TOKEN }}
  - X-Custom-Header: value

Geolocation

Simulate geographic location:
Geolocation:
  Latitude: 37.7749
  Longitude: -122.4194

Permissions

Grant browser permissions:
Permissions:
  - geolocation
  - notifications
  - camera

Best Practices

Environment-Specific Settings

Use environment settings for:
  • Different timeouts per environment (staging vs prod)
  • Environment-specific headers
  • Browser variations

Optimize for CI

In continuous integration:
  • Enable headless mode
  • Record video on failure only
  • Disable traces unless debugging
  • Set appropriate timeouts

Debug Settings

When investigating issues:
  • Disable headless
  • Enable all recordings
  • Enable trace
  • Increase timeouts

Troubleshooting

Tests Timing Out

  1. Check which step times out
  2. Increase step or navigation timeout
  3. Verify element loads correctly
  4. Check for slow network/API calls

Video Not Recording

  1. Verify video setting is enabled
  2. Check storage quota
  3. Ensure test completed (not cancelled)
  4. Wait for video processing

Screenshots Missing

  1. Verify screenshot setting is enabled
  2. Check if step actually executed
  3. Ensure run completed normally
  4. Check for execution errors

Trace Not Available

  1. Verify trace setting was enabled before run
  2. Check if run completed
  3. Re-run with trace enabled