Overview
Run History provides a complete record of all test executions. Track test performance over time, identify patterns in failures, and access detailed results for debugging. Use run history to understand test reliability and maintain quality.Accessing Run History
Test-Level History
View runs for a specific test:- Open a test case
- Click the Runs tab
- See all executions for this test
Test Plan History
View runs for a test plan:- Open a test plan
- Click Run History
- See all plan executions
Global Run History
View all runs across your organization:- Navigate to Runs in the main menu
- Use tabs to switch between Test Runs, Grouped Runs, and Run Configs
- Filter by environment and browse executions
Run Information
Run Status
Each run has a status:| Status | Description |
|---|---|
| Passed | All steps completed successfully |
| Failed | One or more steps failed |
| Running | Currently executing |
| Queued | Waiting to execute |
| Cancelled | Manually stopped |
| Timed Out | Exceeded maximum duration |
Run Details
Click on any run to see comprehensive execution details with tabs for:- Summary: Pass/fail status, duration, timestamp, and key metrics
- Steps: Individual step results with status indicators
- Video: Full execution recording with playback controls
- Screenshots: Step-by-step images captured during execution
- Trace: Detailed execution timeline with actions, waits, and network requests
- Logs: Test execution logs with both AI-generated summaries and raw technical output
- AI Execution: Detailed logs from AI-driven steps showing agent decisions, AI assertions, and auto-healing actions
- Inbox: Emails and TOTP codes captured during the test run
Run Metadata
Each run includes:| Field | Description |
|---|---|
| Run ID | Unique identifier |
| Started At | Execution start time |
| Duration | Total execution time |
| Run Config | Config used (or Default) |
| Environment | Environment used |
| Trigger | How run was started |
| Browser | Browser type used |
Filtering Runs
By Status
Filter to specific outcomes:- Passed: View successful runs
- Failed: View failures for debugging
- All: See complete history
By Date Range
View runs within a timeframe:- Last 24 hours
- Last 7 days
- Last 30 days
- Custom range
By Trigger Type
Filter by how runs were started:| Trigger | Description |
|---|---|
| Manual | Run button clicked |
| Editor | Run from test editor |
| Scheduled | Test plan scheduled run |
| API | Triggered via API |
| CI/CD | Triggered from pipeline |
By Environment
View runs in specific environments:- Development
- Staging
- Production
- Custom environments
Analyzing Runs
Comparing Runs
Compare multiple runs:- Select runs to compare
- View side-by-side results
- Identify differences in:
- Step outcomes
- Duration changes
- Error patterns
Identifying Patterns
Look for trends:- Consistent failures: Same step failing repeatedly
- Intermittent failures: Flaky test indicators
- Duration changes: Performance regressions
- Environment-specific: Failures in certain environments
Reliability Metrics
Track test health:| Metric | Description |
|---|---|
| Pass rate | Percentage of passing runs |
| Avg duration | Average execution time |
| Flakiness | Rate of inconsistent results |
| Last pass | Most recent successful run |
| Last fail | Most recent failed run |
Runs Page Analytics
The Runs tab in test case details provides comprehensive analytics and visual insights into test execution history. It includes two sub-tabs: History and Insights.History Tab
The History tab shows a chronological list of all test executions:- Run Status: Visual indicators for passed, failed, running, queued, cancelled, or timed out runs
- Execution Details: Duration, timestamp, environment, and trigger type for each run
- Grouped Runtime Rows: Matrix runs (multiple configs/browsers/viewports) are grouped and expandable
- Quick Actions: Re-run, view details, or compare runs
- Filtering: Filter by status, date range, environment, or trigger type
Insights Tab
The Insights tab provides AI-powered analytics and actionable intelligence about your test’s reliability and failure patterns: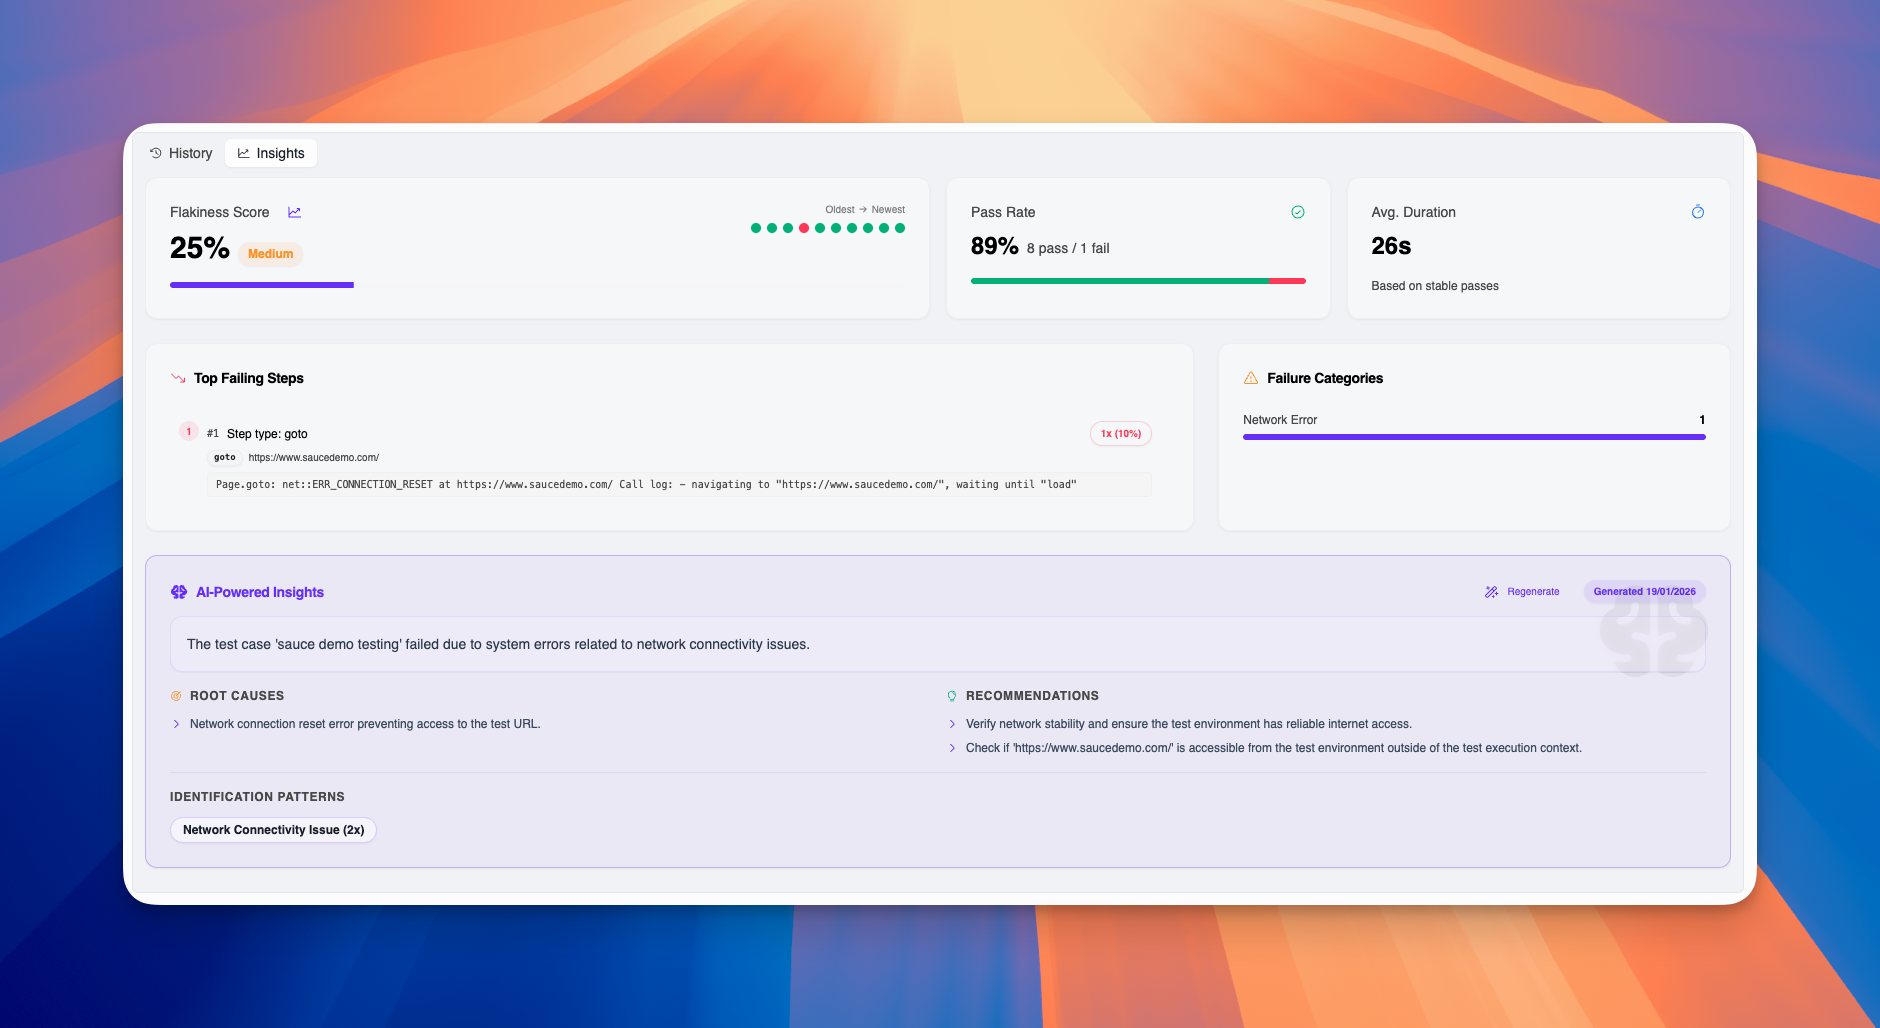
Key Metrics
Flakiness Score- Percentage indicating test reliability (0% = stable, 100% = highly flaky)
- Color-coded severity indicator (green = low, yellow = medium, red = high)
- Helps prioritize which tests need attention and stabilization
- Click the info icon to learn more about how flakiness is calculated
- Success percentage across recent runs
- Shows exact count: “X pass / Y fail”
- Visual bar chart with green (pass) and red (fail) segments
- Helps quickly assess overall test health
- Typical execution time based on stable (passing) runs
- Excludes failed runs to provide accurate performance baseline
- Useful for identifying performance regressions
- Click the info icon for calculation details
- Visual dot chart showing pass/fail patterns from oldest to newest
- Green dots = passed runs, Red dots = failed runs
- Quick visual assessment of test stability trends
- Hover over dots to see individual run details
Failure Analysis
Top Failing Steps- Lists the most frequently failing steps in descending order
- Shows step type, target/URL, and exact error message
- Displays occurrence count and percentage (e.g., “1x (10%)”)
- Helps identify which specific steps need fixing or stabilization
- Expandable cards show full error details
- Breakdown of failure types across all failed runs
- Common categories: Network Error, Timeout, Assertion Failed, Element Not Found, etc.
- Visual distribution bars show relative frequency
- Click categories to filter Top Failing Steps by that failure type
- Helps identify systemic issues vs. step-specific problems
AI-Powered Insights
The AI-Powered Insights section analyzes all run data to provide actionable intelligence: Summary- Natural language explanation of why the test is failing
- Synthesizes patterns across multiple runs
- Provides context about failure frequency and impact
- AI-identified underlying reasons for test failures
- Goes beyond surface-level errors to find systemic issues
- Examples: “Network connection reset error preventing access to the test URL”
- Helps focus debugging efforts on the actual problem
- Actionable suggestions to improve test stability
- Specific steps you can take to fix failures or reduce flakiness
- Examples: “Verify network stability and ensure the test environment has reliable internet access”
- Prioritized based on impact and feasibility
- Common failure patterns detected across runs
- Shows how many times each pattern occurred (e.g., “Network Connectivity Issue (2x)”)
- Helps identify whether failures are consistent or varied
- Refresh AI analysis with the latest run data
- Useful after fixing issues or adding new runs
- Shows generation timestamp so you know when insights were last updated
Using Insights Effectively
- Assess Test Health: Check the Flakiness Score and Pass Rate to understand overall reliability
- Identify Problem Areas: Review Top Failing Steps to see which steps fail most frequently
- Understand Failure Types: Use Failure Categories to see if issues are network-related, timing-based, or assertion failures
- Get AI Guidance: Read Root Causes and Recommendations for expert analysis and next steps
- Track Improvements: Regenerate insights after fixes to validate improvements
- Prioritize Work: Use flakiness scores across tests to decide which need attention first
Run Actions
Re-run a Test
Repeat a previous execution:- Open the run details
- Click Re-run
- Test executes with same configuration
Re-run Failed Steps
Re-run only failed steps:- Open a failed run
- Click Re-run Failed
- Only failed steps execute
Cancel Running Tests
Stop an in-progress run:- Find the running test
- Click Cancel
- Run stops immediately
Delete Runs
Remove old run data:- Select runs to delete
- Click Delete
- Confirm removal
Run Artifacts
Video Recordings
Access execution videos:- Open run details (from the Runs tab, click on a specific run)
- Click the Video tab
- Play or download recording
- Scrub to failure point
- Watch at 2x speed for quick review
- Download for sharing
Screenshots
View step screenshots:- Open run details (from the Runs tab, click on a specific run)
- Click the Screenshots tab
- Navigate through images
- Verify correct page loaded
- Check element visibility
- Compare expected vs actual
Trace Files
Inspect detailed traces:- Open run details (from the Runs tab, click on a specific run)
- Click the Trace tab
- Open Trace Viewer
- Review network requests
- Inspect DOM at each step
- Check console messages
- Analyze timing
Logs
Access execution logs:- Open run details (from the Runs tab, click on a specific run)
- Click the Logs tab to view test execution logs
- Switch between AI-generated summaries and raw technical logs
- Search for errors or patterns
AI Execution Logs
View detailed AI execution information:- Open run details (from the Runs tab, click on a specific run)
- Click the AI Execution tab
- Review agent decisions, AI assertions, and auto-healing actions
Inbox
Access emails and TOTP codes:- Open run details (from the Runs tab, click on a specific run)
- Click the Inbox tab
- View emails, extract verification codes, and access links
Notifications
Failure Alerts
Get notified on failures:- Go to Settings > Notifications
- Enable failure alerts
- Choose delivery method (email, Slack)
- Receive alerts on test failures
Summary Reports
Receive periodic summaries:- Daily test results
- Weekly reliability reports
- Monthly trend analysis
Best Practices
Regular Review
- Check run history daily for failures
- Review flaky tests weekly
- Analyze trends monthly
Debugging Workflow
- Identify failed run
- Check error message in logs
- Watch video at failure point
- Review screenshot before failure
- Inspect trace for details
- Fix and re-run
Managing History
- Delete old runs to manage storage
- Export important runs before deletion
- Keep runs for compliance requirements
Using Filters Effectively
- Start broad, then narrow
- Save common filter combinations
- Use date ranges for trend analysis
Troubleshooting
Runs Not Appearing
- Refresh the run history page
- Check filter settings aren’t hiding runs
- Verify test actually executed
- Check for system issues
Missing Artifacts
- Verify run completed (not cancelled)
- Check if artifacts were enabled
- Wait for upload/processing
- Re-run if artifacts missing
Old Runs Unavailable
- Check retention policy
- Verify runs weren’t deleted
- Contact admin for archived data
Performance Issues
If run history loads slowly:- Narrow date range filter
- Filter by specific tests
- Clear browser cache
- Reduce items per page
Related
- Test Configuration - Configure how tests run
- Debugging Tests - Use run artifacts for debugging
- Test Plans - Scheduled test runs
- Execution - Understanding test execution