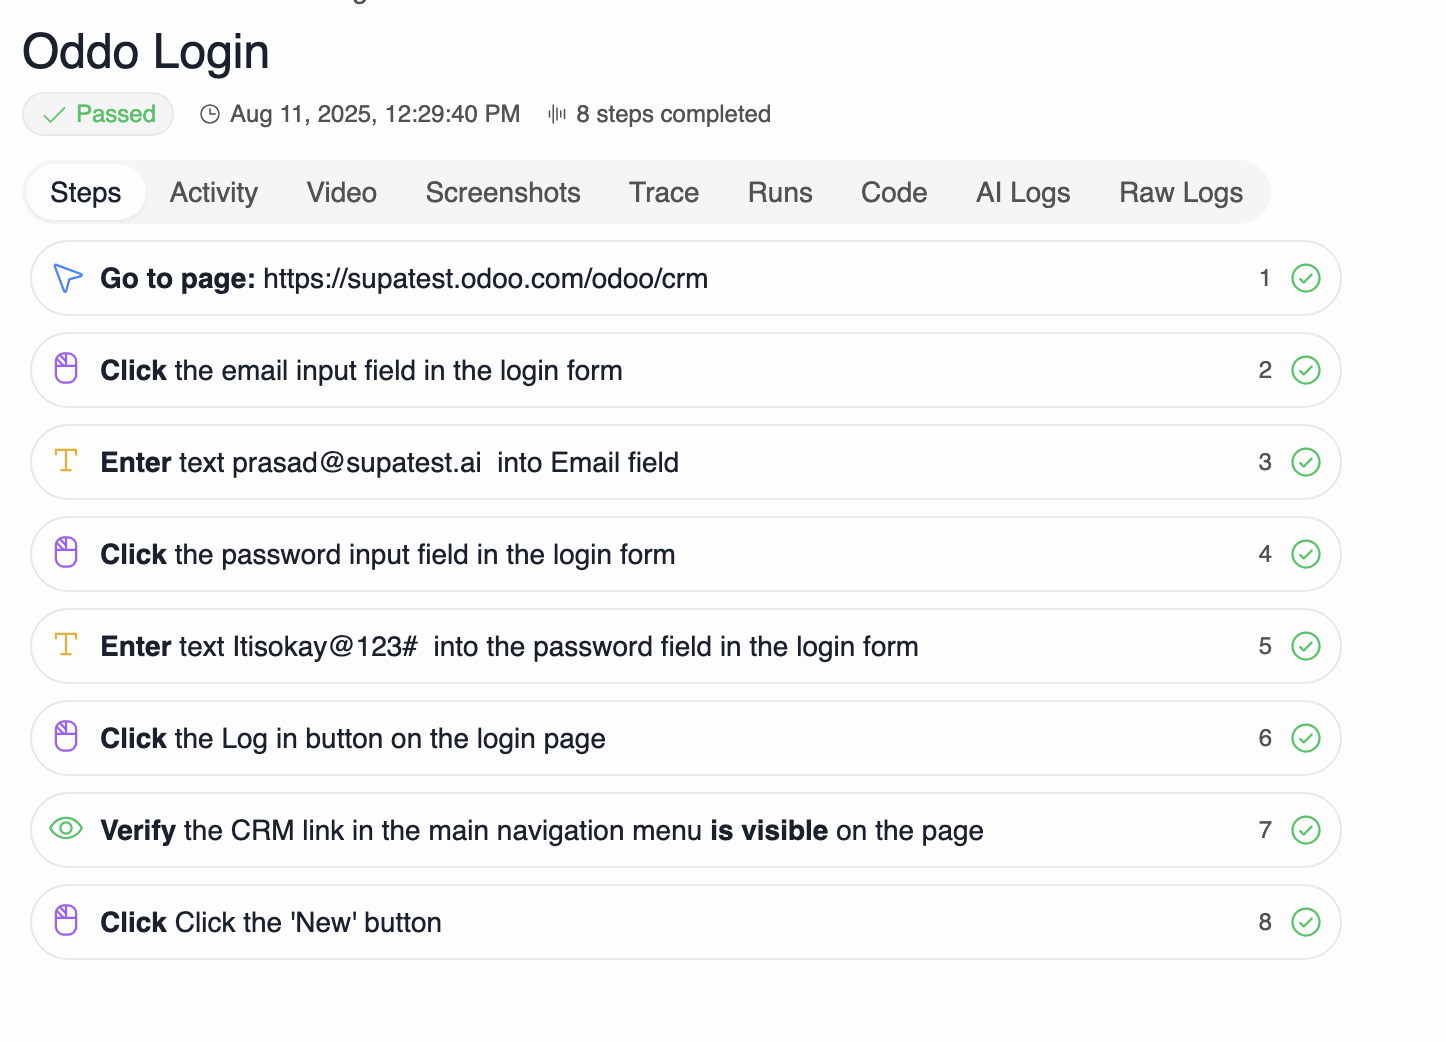
Video overview
Overview
How a run progresses, what updates in real time, and how to debug quickly when a step fails.
End‑to‑end lifecycle
- Start: click Run All (entire test) or Run Selected (subset). The header shows Running and disables editing.
- Session: the live browser connects or resets if needed.
- Execution: steps run in order; each step card moves from in‑progress to passed or failed.
- Artifacts: screenshots (per step), video (full session), trace (timeline), Raw Logs and AI Logs generate alongside execution.
- Completion: the run status is shown; open any step to review its artifacts.
What updates live
- Step status: in‑progress, passed, failed; failing steps are highlighted.
- Raw Logs: streaming technical output from the runner.
- AI Logs: summarized, grouped insights for faster scanning.
- Live preview (when available): reflects current page and interactions.
Debugging workflow (practical)
After a test run completes, access execution assets in the Last Run Report tab (for the most recent run) or in the Runs tab (for historical runs):- Confirm the symptom:
- Open the failing step’s screenshot: check visible state, key text, and URL.
- If unclear, scrub the video around the failure time.
- Read what happened:
- Open Raw Logs on the failing step: look for selector errors, timeouts, JS errors, or network issues.
- Check AI Logs for a concise explanation and suggested next actions.
- Pinpoint timing or state:
- Open Trace: review actions, waits, and network timeline around the failure.
- Correlate timestamps between Trace and Raw Logs.
- Apply a fix:
- Selector: use a more stable attribute or broader strategy.
- Timing: replace fixed sleeps with explicit waits (visible, attached, navigation).
- Data/flow: update environment variables, test data, or add a prerequisite snippet.
- Validate fast:
- Use Run From Step to re‑execute from the failing point.
- Do a full run when multiple assumptions changed.
Note: In the Editor, the Editor Console at the bottom also displays assets from the last run executed in the editor, providing quick access without leaving the editor view.
Quick triage checklist
- First failing step: fix earliest break; later errors often cascade.
- Repeated failure on the same step: likely selector or timing fragility.
- Rising run duration: check network calls and waits in Trace.
- Confusing logs: read AI Logs first, then drill into Raw Logs.
Common scenarios and remedies
- Element not found or detached: stabilize locator; wait for visible/attached.
- Navigation timeout: ensure the action triggers navigation; wait for the correct event; verify target URL.
- Dynamic content: prefer state‑based waits (text present, spinner gone) over fixed delays.
- Data/env mismatch: confirm environment variables and inputs; log key values.

