Overview
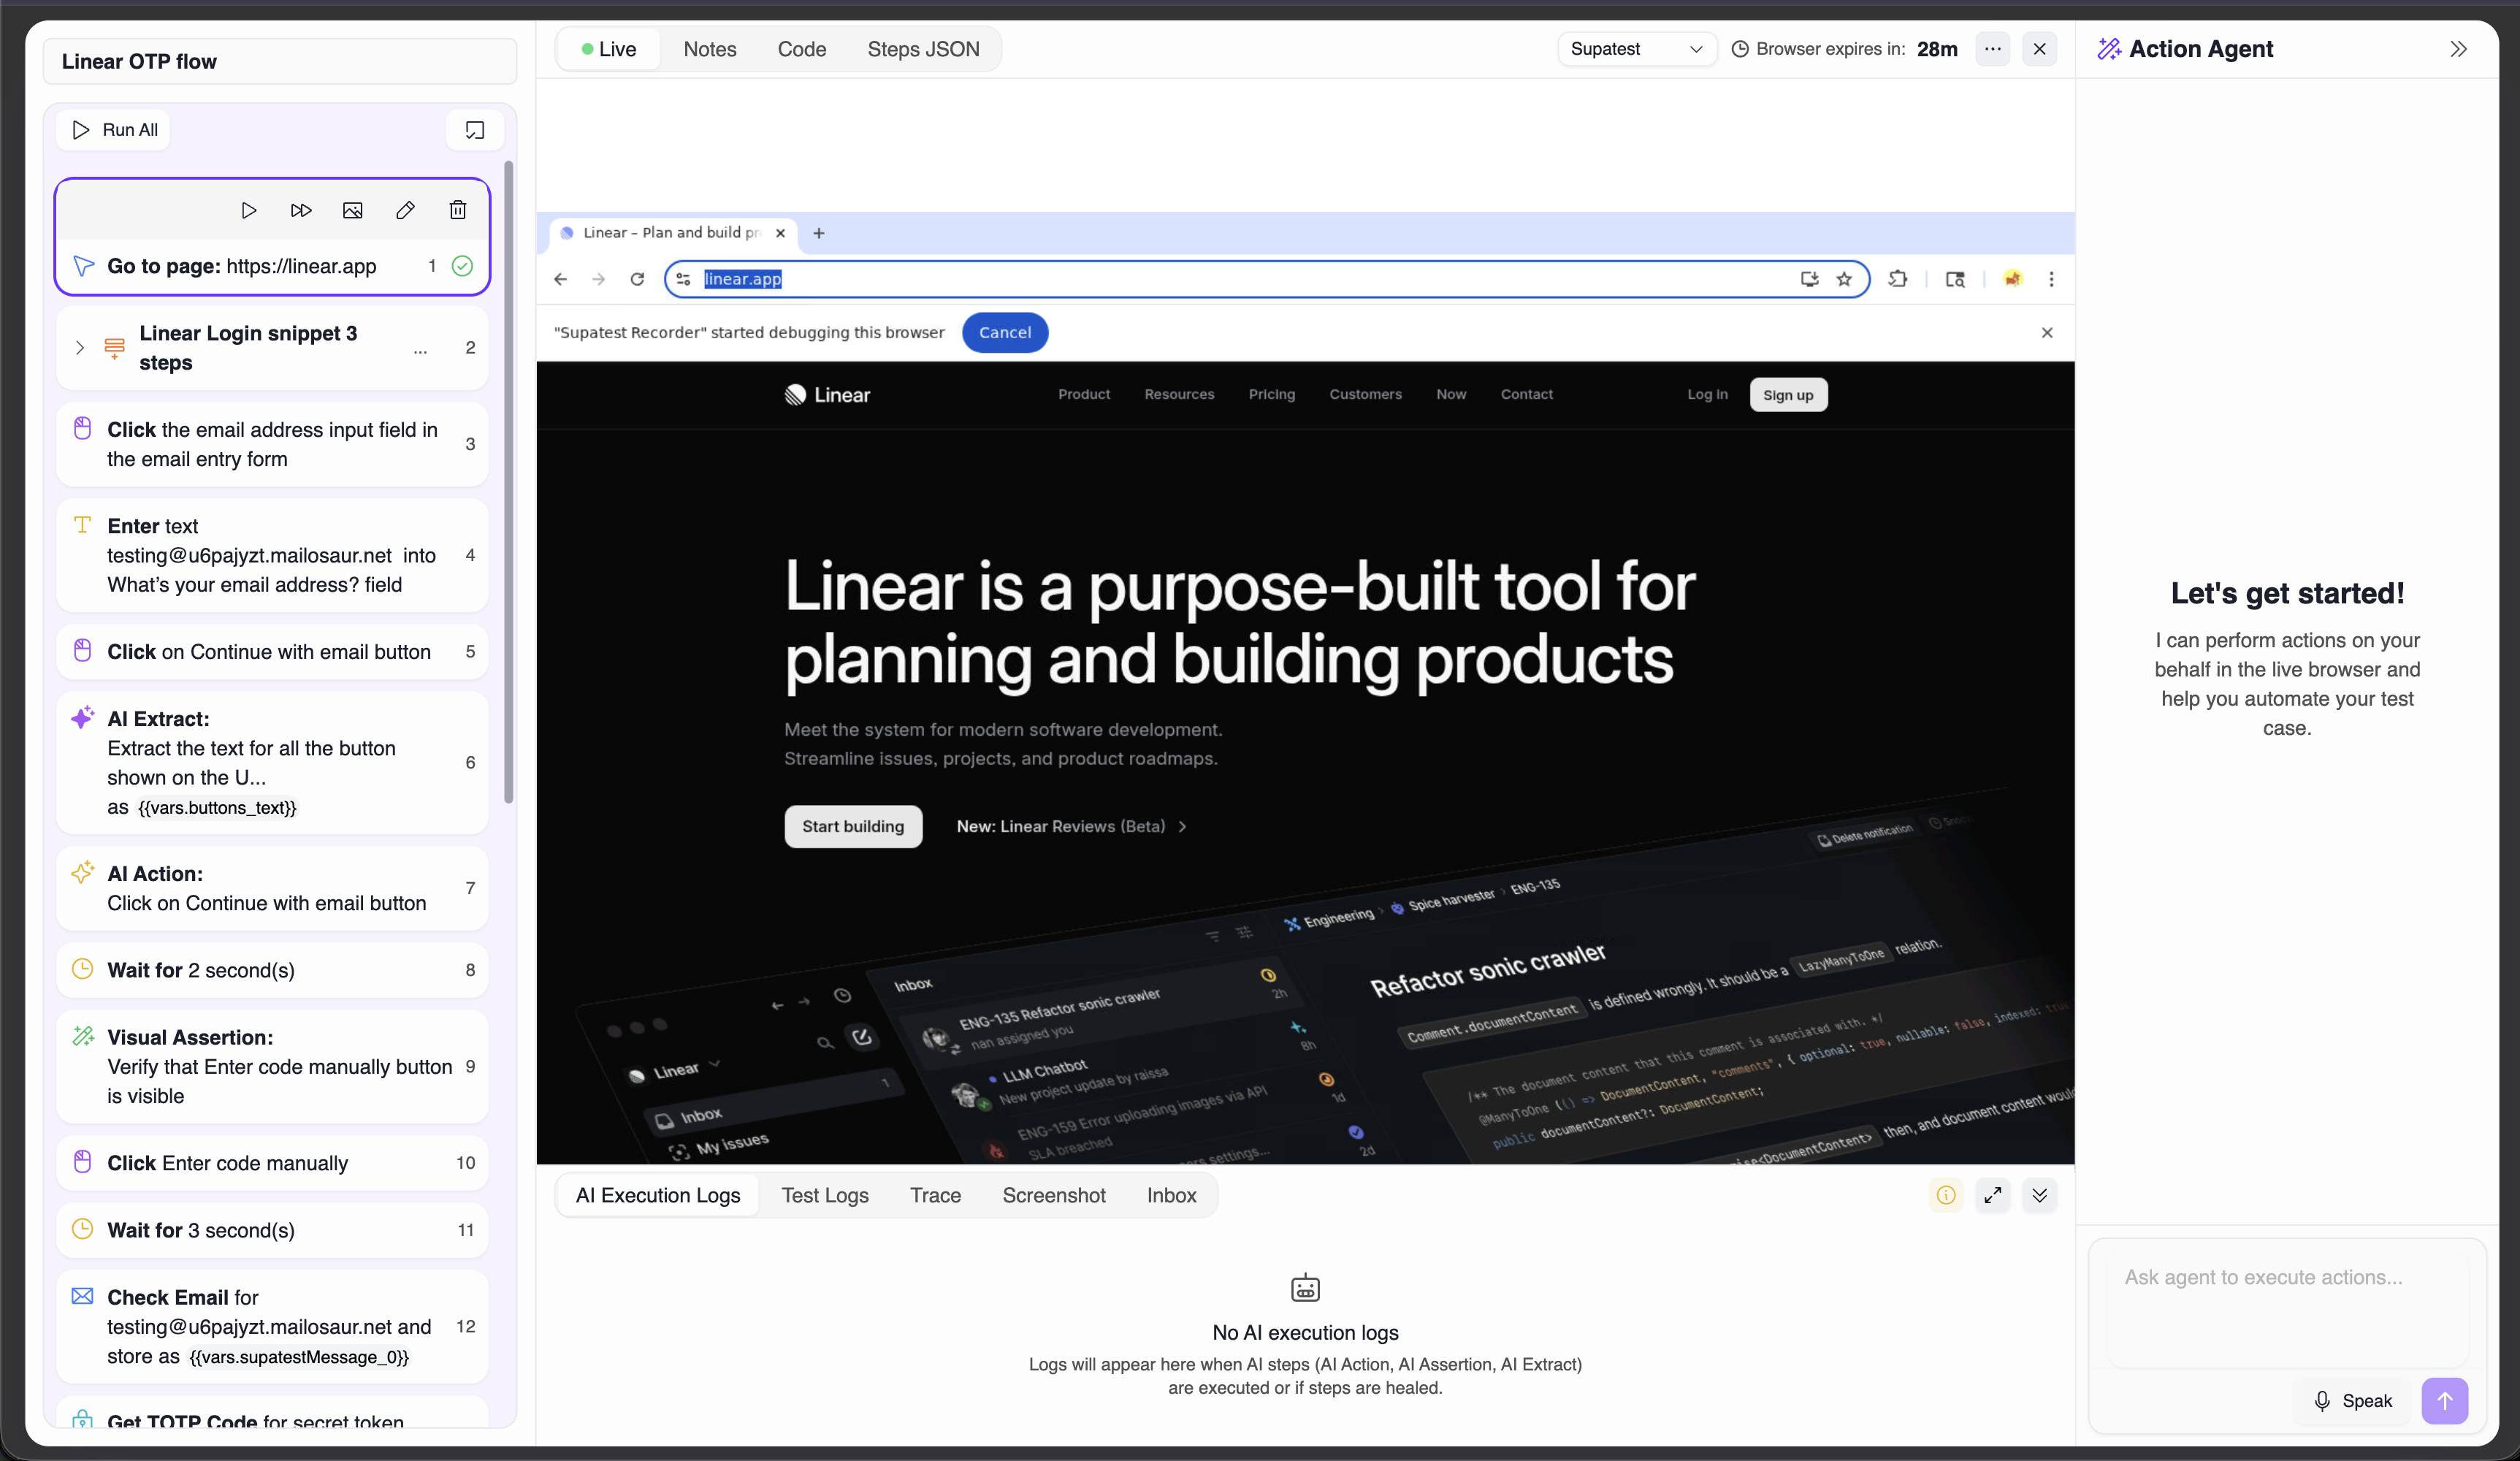
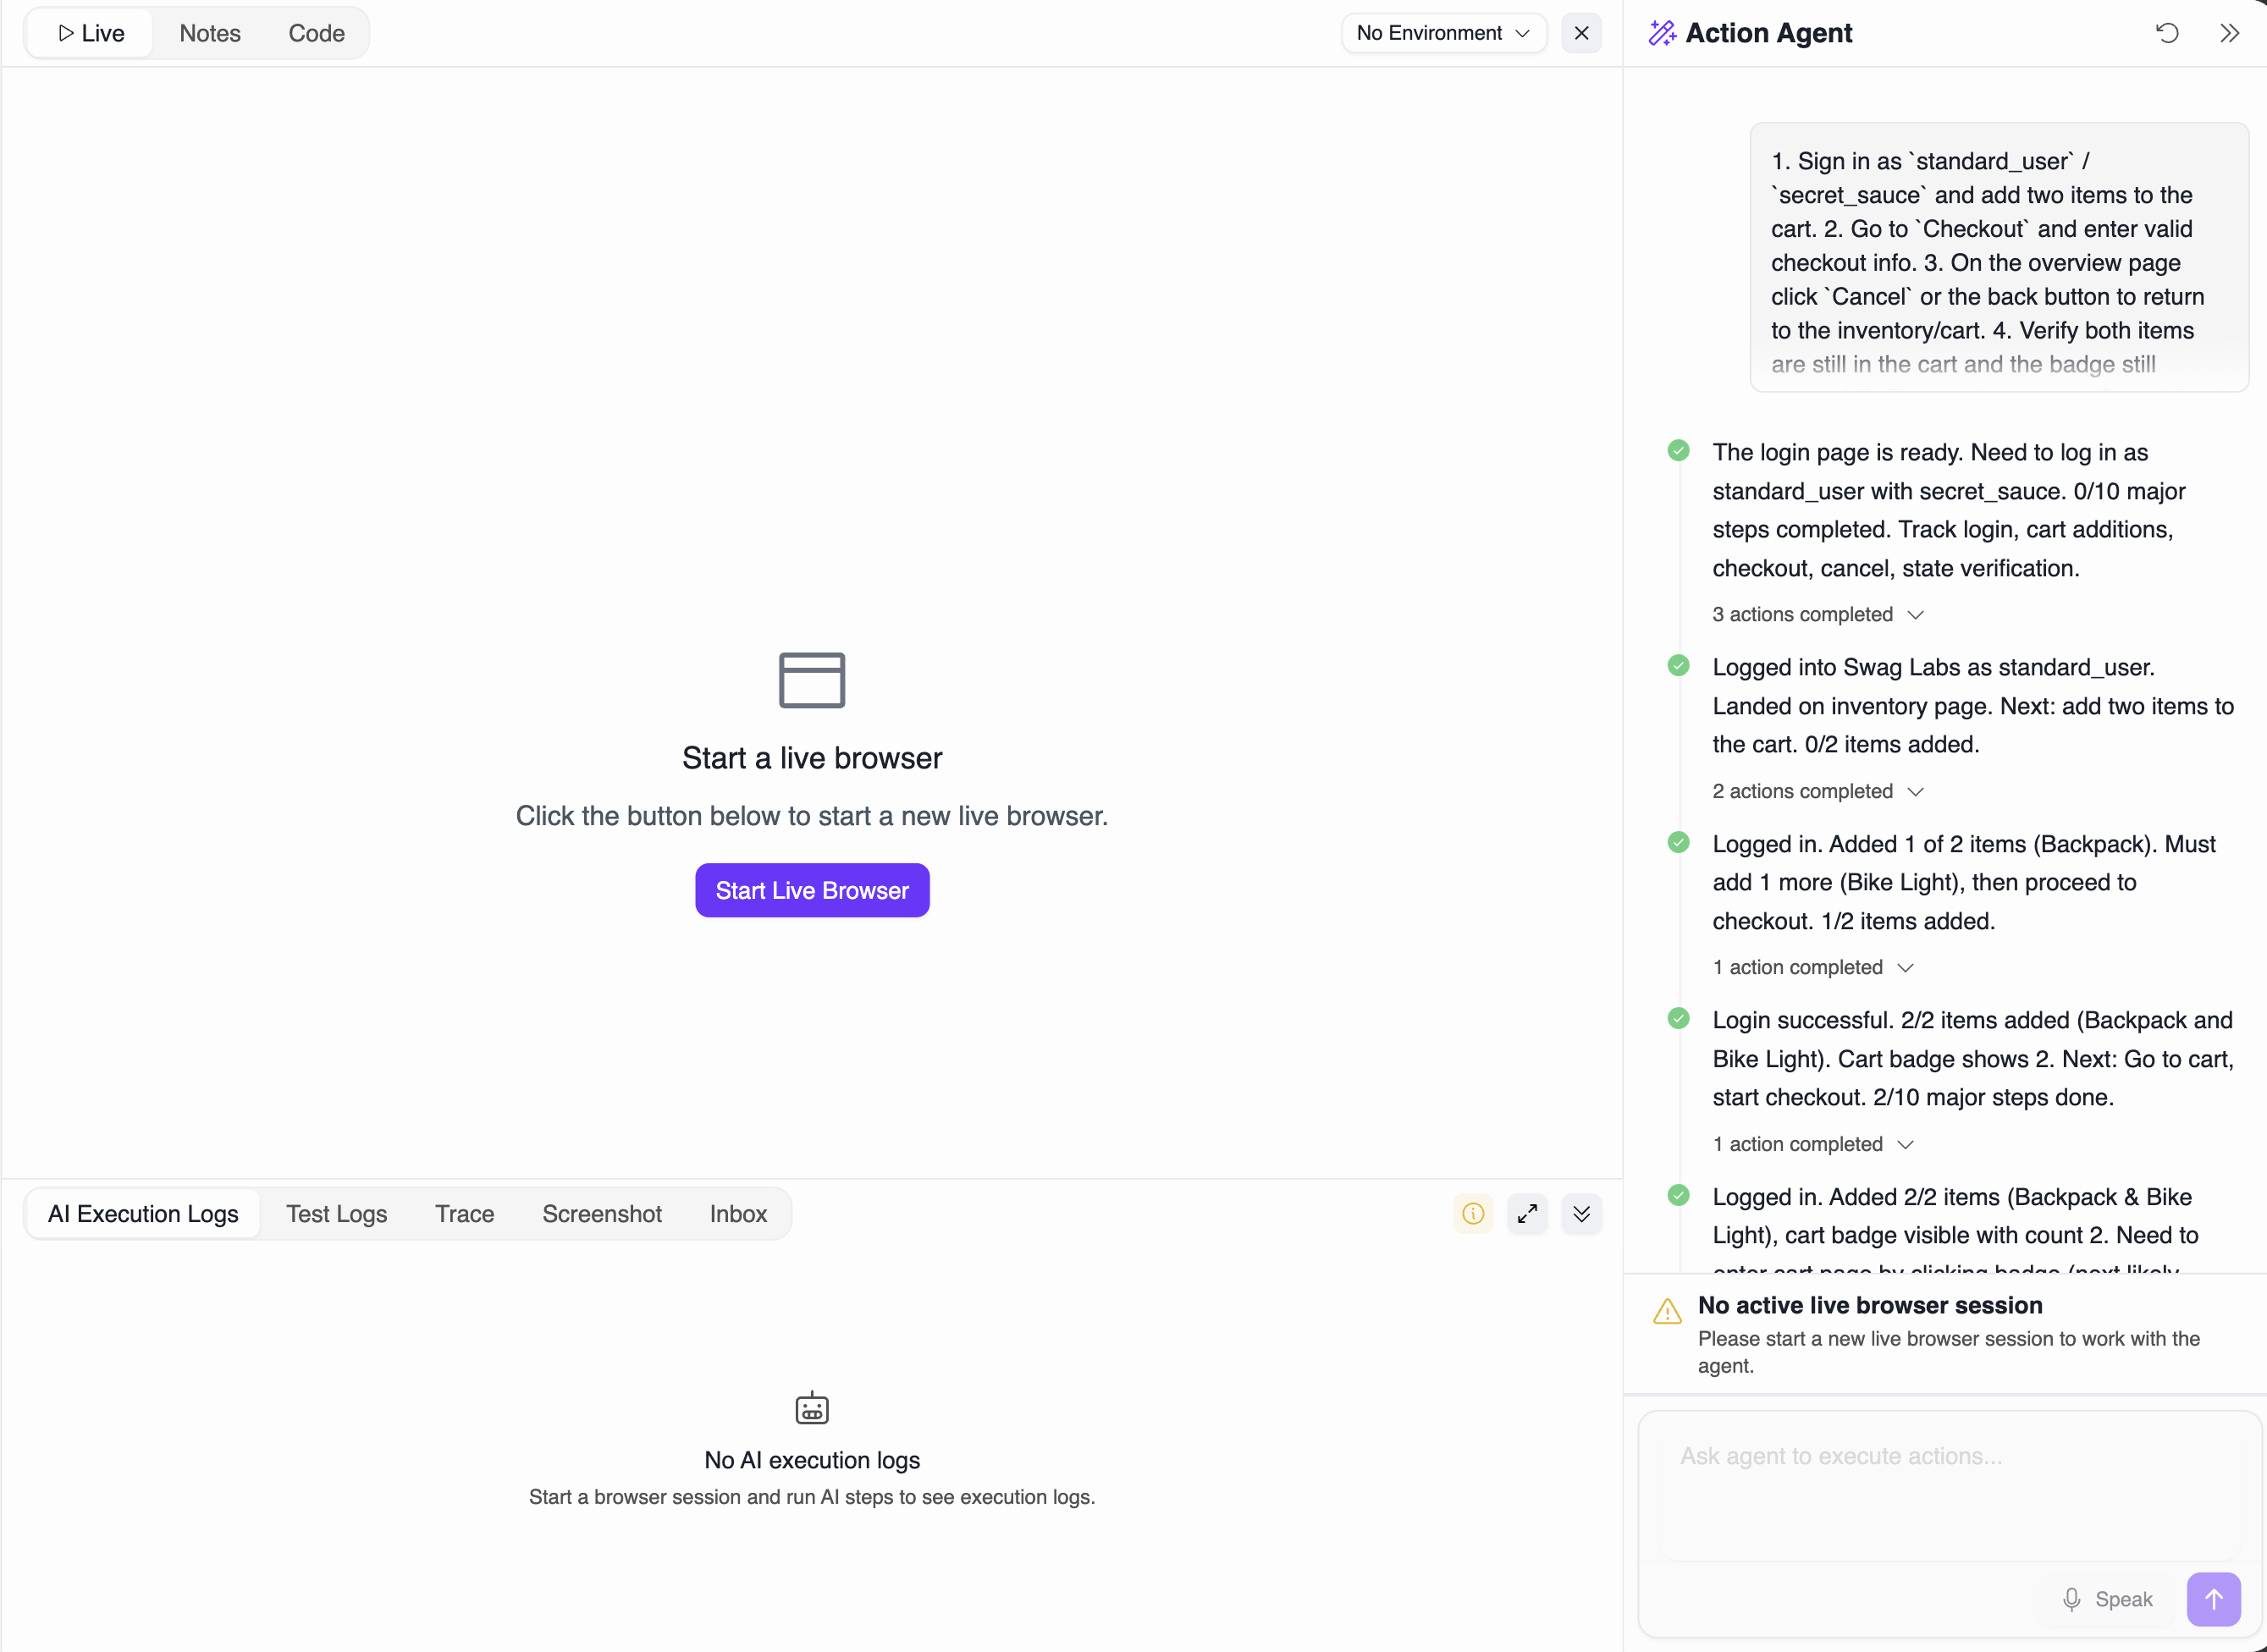
The Editor is where you build and run tests. The editor features a four-panel layout: a left sidebar for managing test steps, a central area for the live browser preview, a bottom console panel that displays all execution assets and logs from your test runs, and a right panel for the Action Agent chat interface.Layout
The editor is organized into four main sections:- Left Sidebar: Steps pane for building and managing test steps
- Central Area: Live browser preview where you can watch test execution in real time
- Bottom Panel (Editor Console): Console that displays all assets from the last run, including logs, screenshots, trace, AI execution logs, and inbox items
- Right Panel (Action Agent): Chat interface for interacting with the AI Action Agent to perform actions in the live browser. This panel is collapsed by default and can be expanded when needed.
Build steps
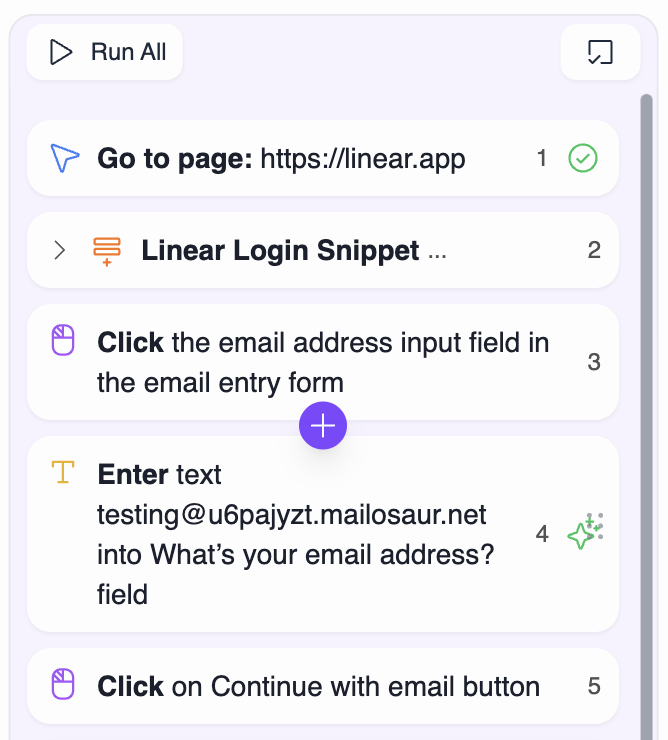
- Add: click the plus button between steps to insert a new step
- Edit: click a step to open its form; fields support Expressions
{{ ... }}for env, vars, random - Reorder: drag to move steps; order updates automatically
- Delete: use the step menu
- Convert to snippet: select multiple steps, then Save as Snippet
- AI generate: use Generate to add steps from a goal
- Element picker: activate when a step needs a locator; pick directly from the live page

Selection mode
- Toggle selection mode to choose multiple steps
- Actions: Run Selected, Create snippet from selection, Delete

Run controls
- Run All: execute the full test from the first step
- Run From Step: hover a step and choose to start there
- Run Selected: execute only the steps you selected
- Reset session: start a fresh browser session before running
- Status: the header shows Running and a spinner during execution
Tip: When fixing a failure, prefer Run From Step to iterate faster.
Test Case Settings
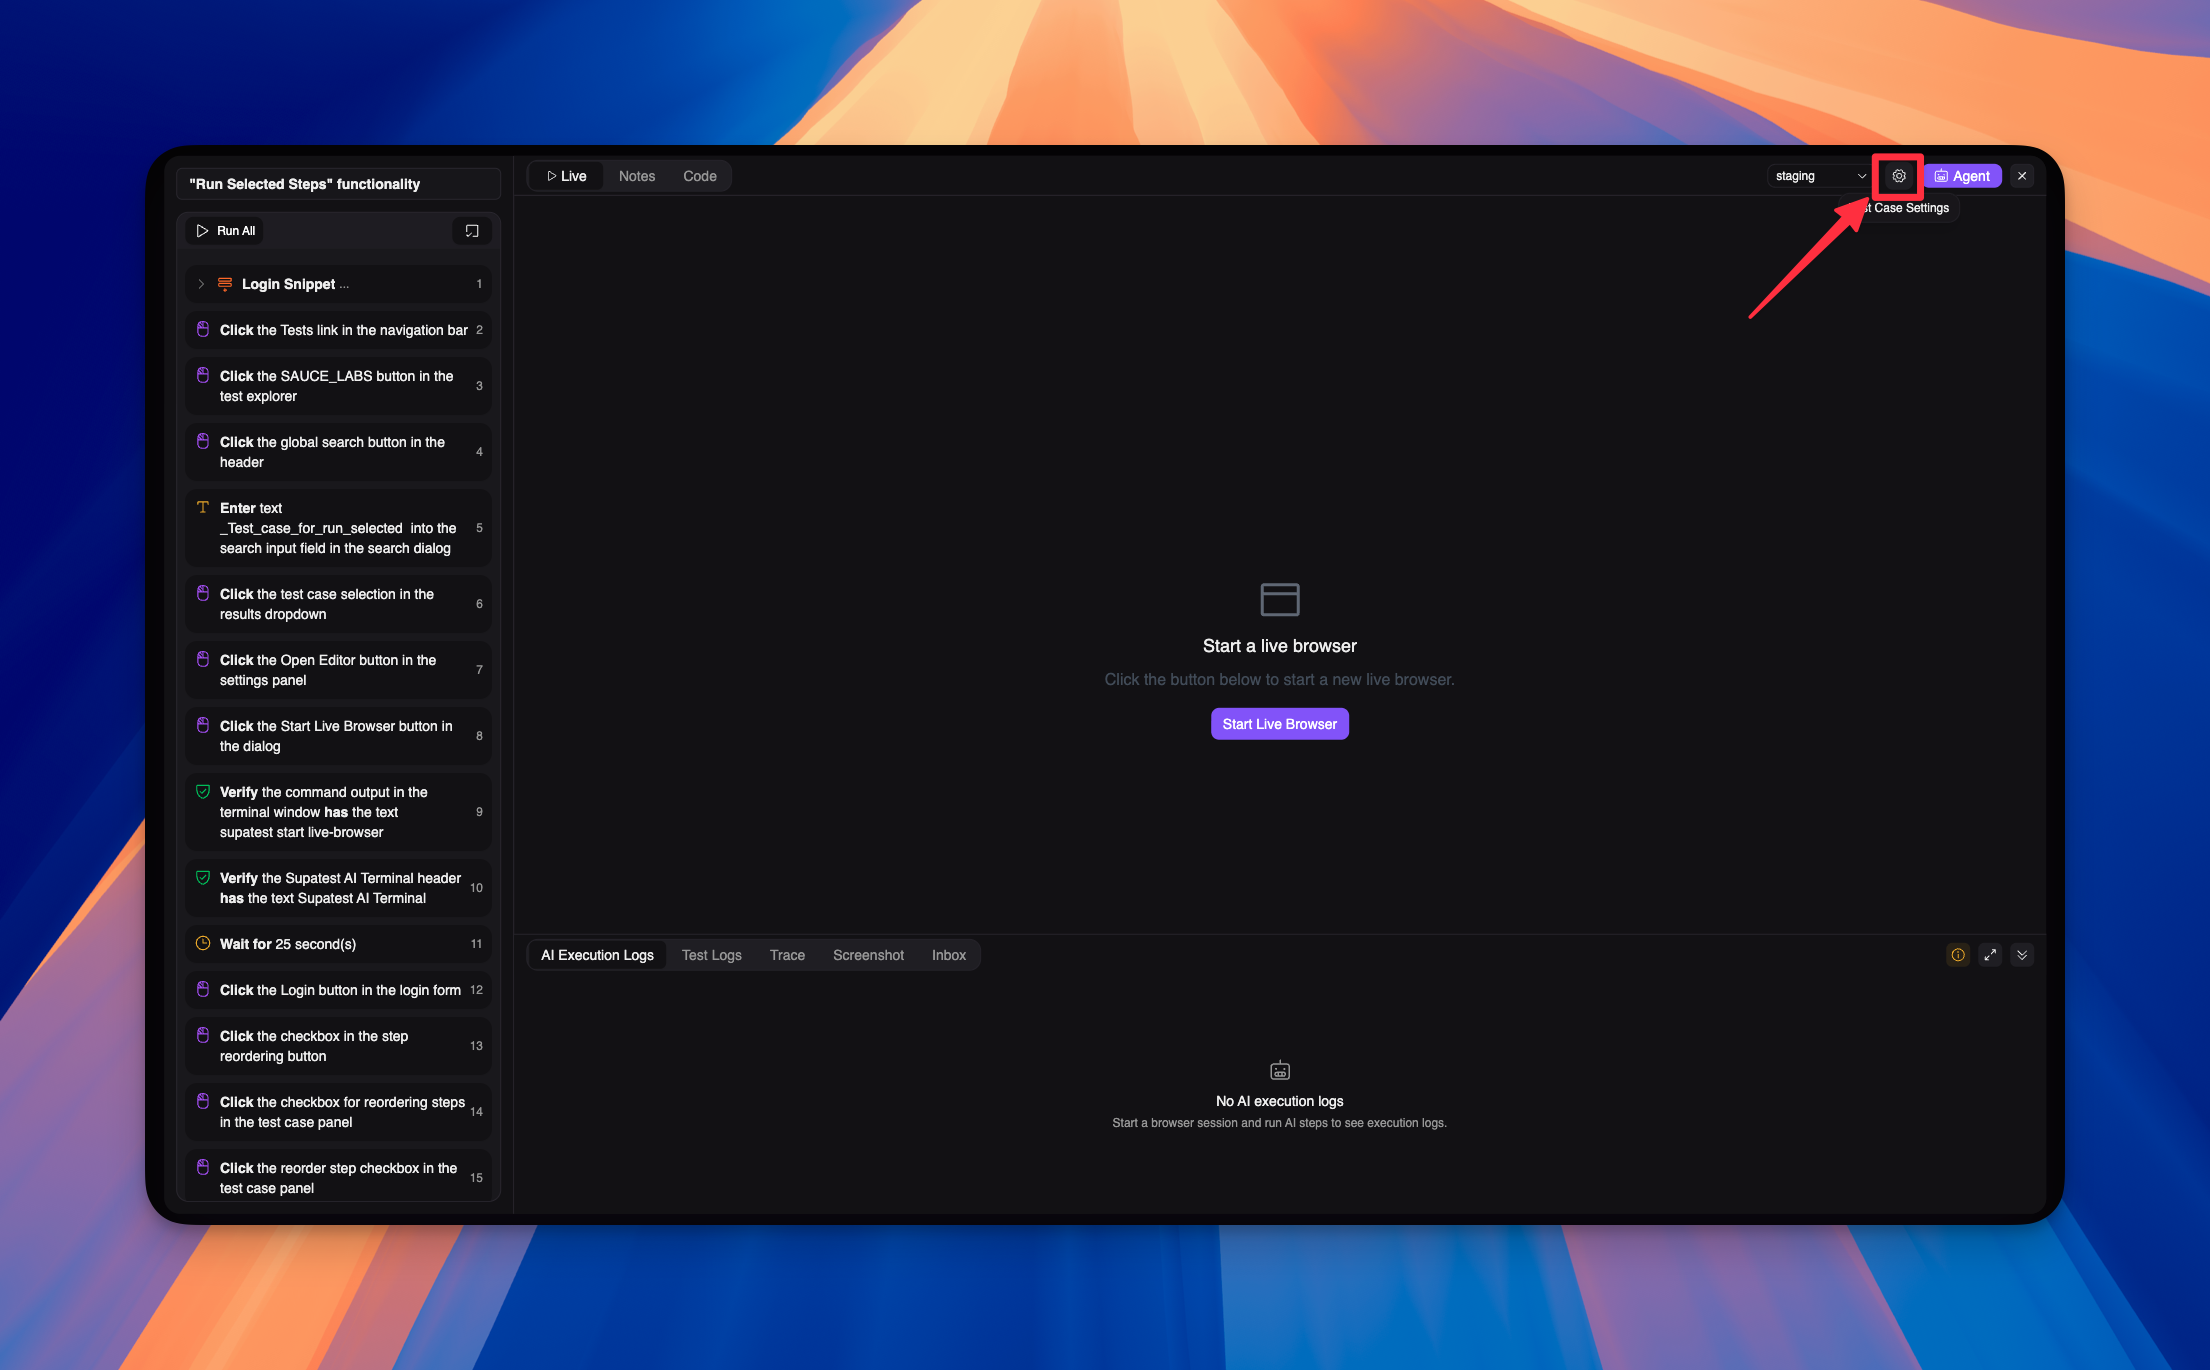
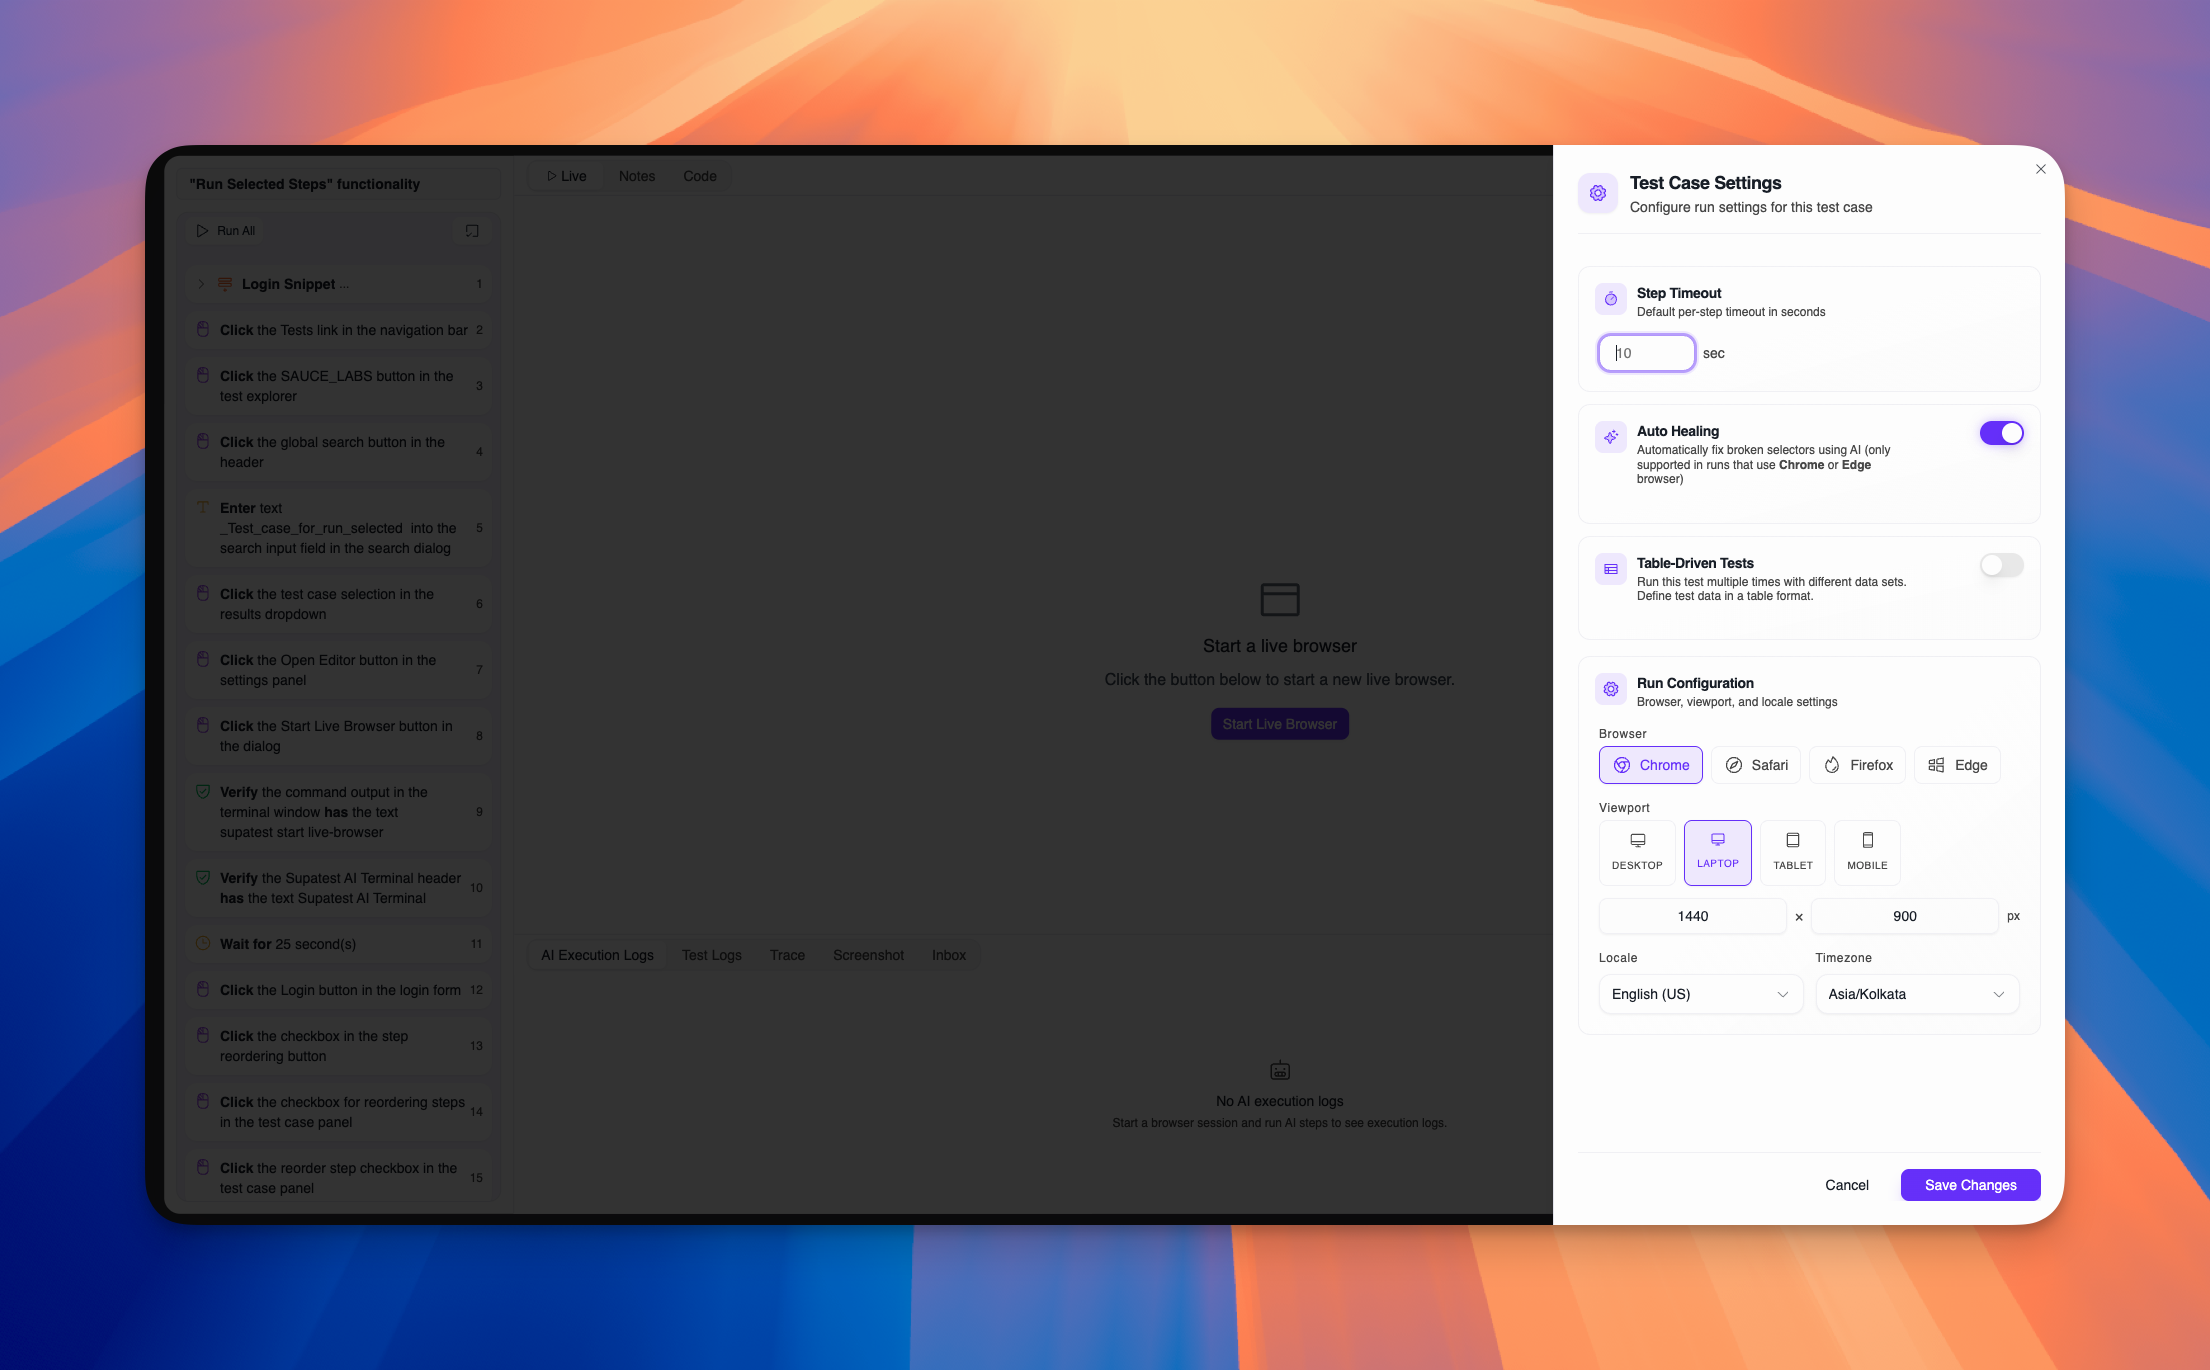
The Test Case Settings dialog allows you to configure execution parameters for your test case. Access it by clicking the Settings button in the test case header.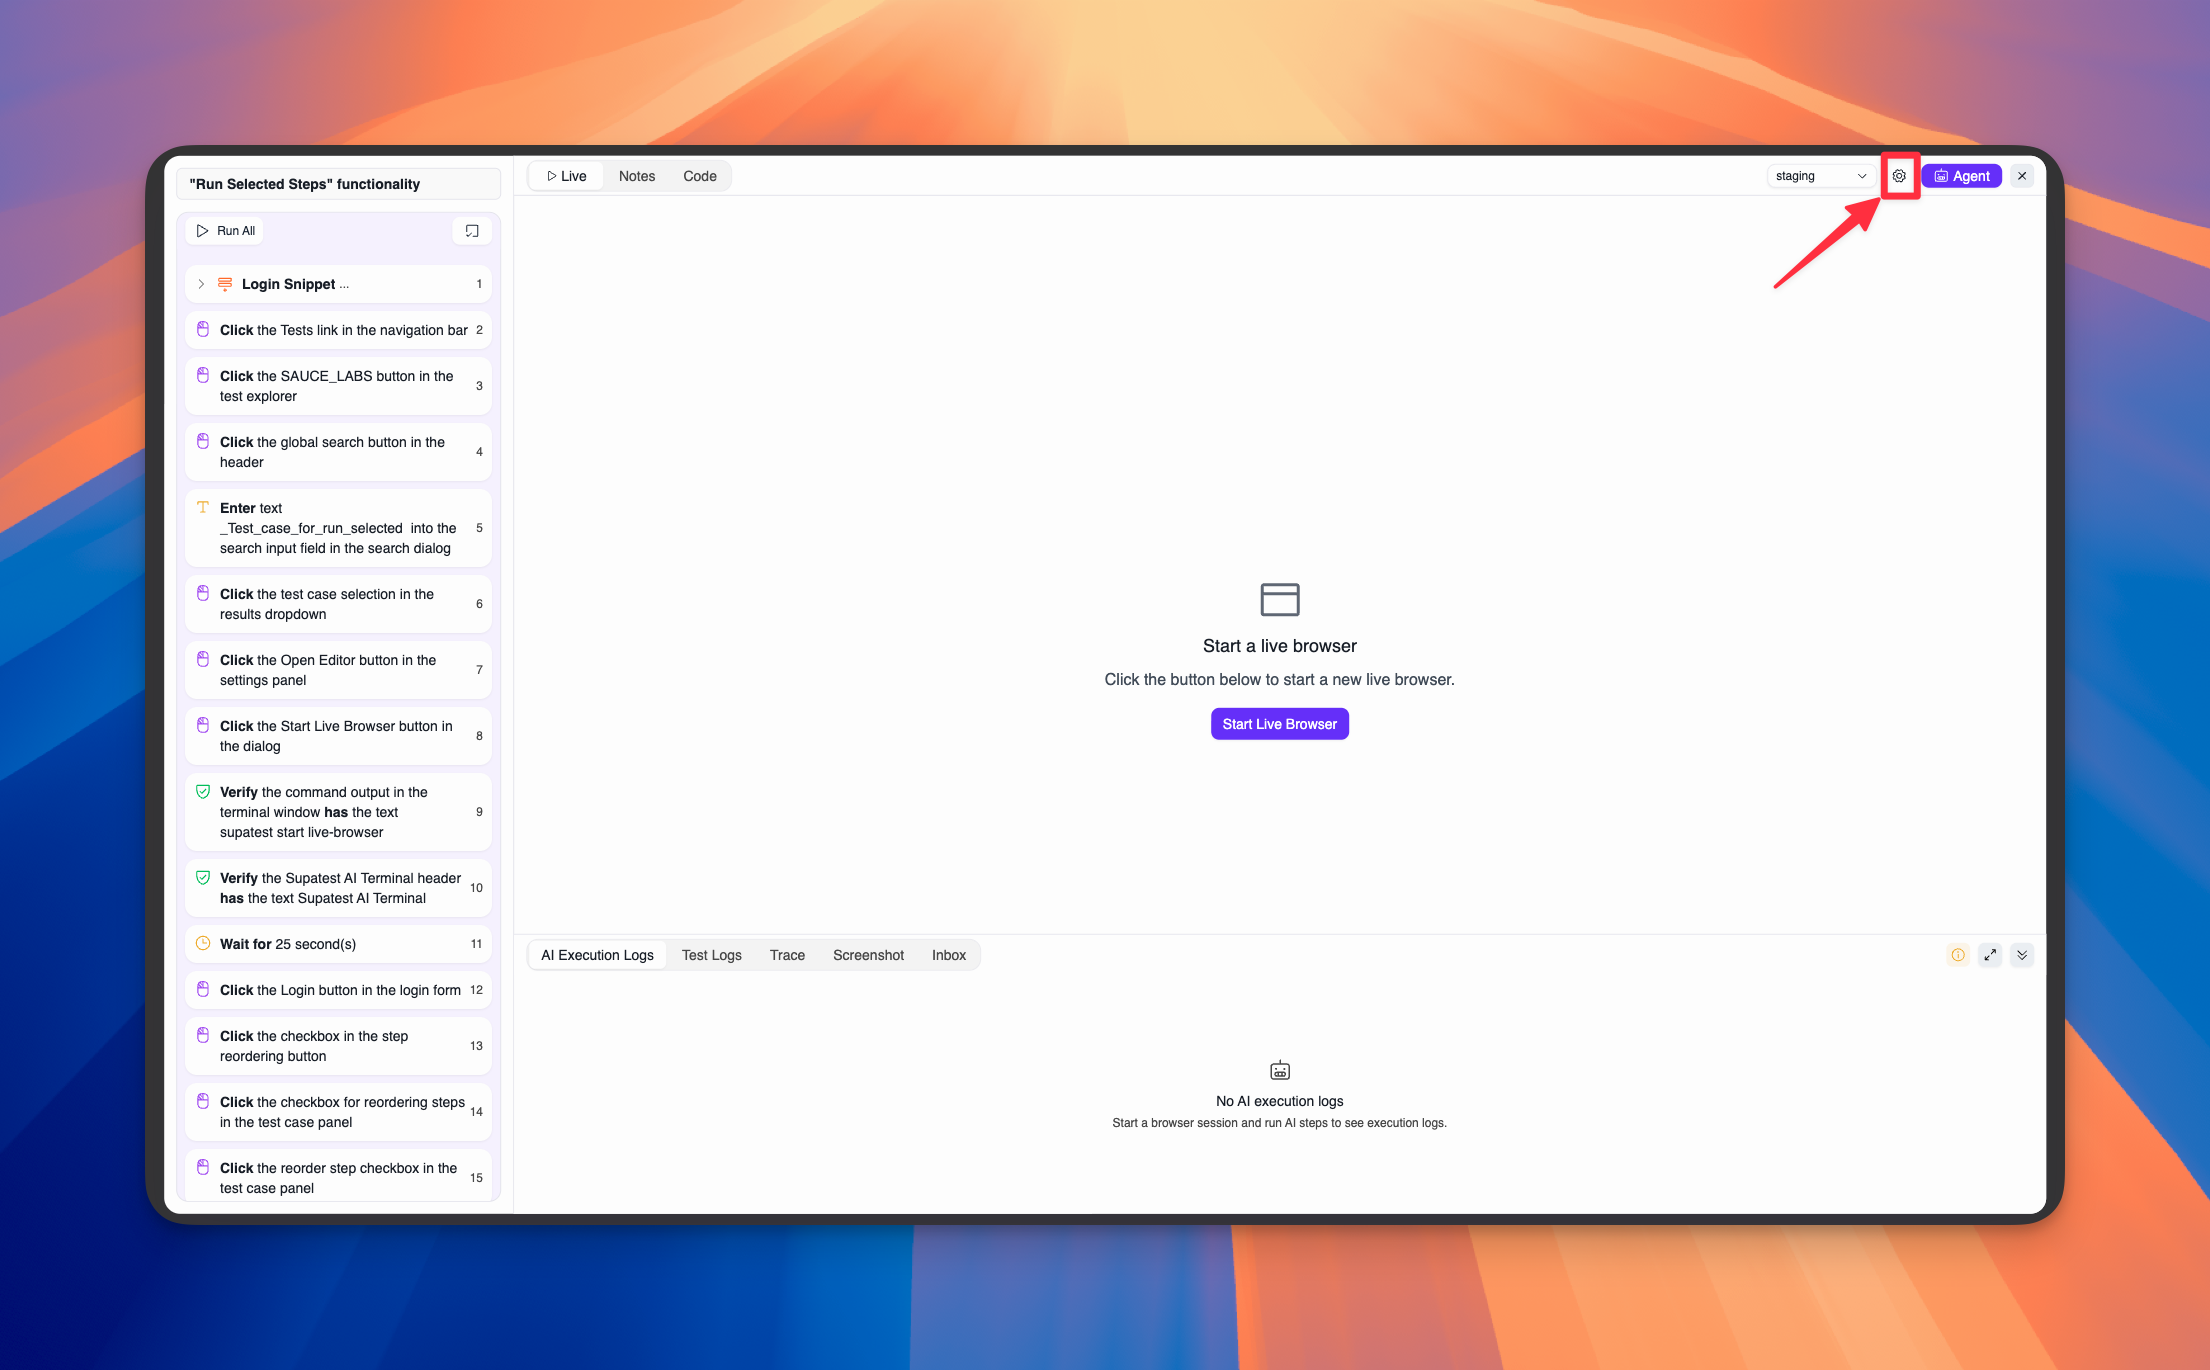
Available Settings
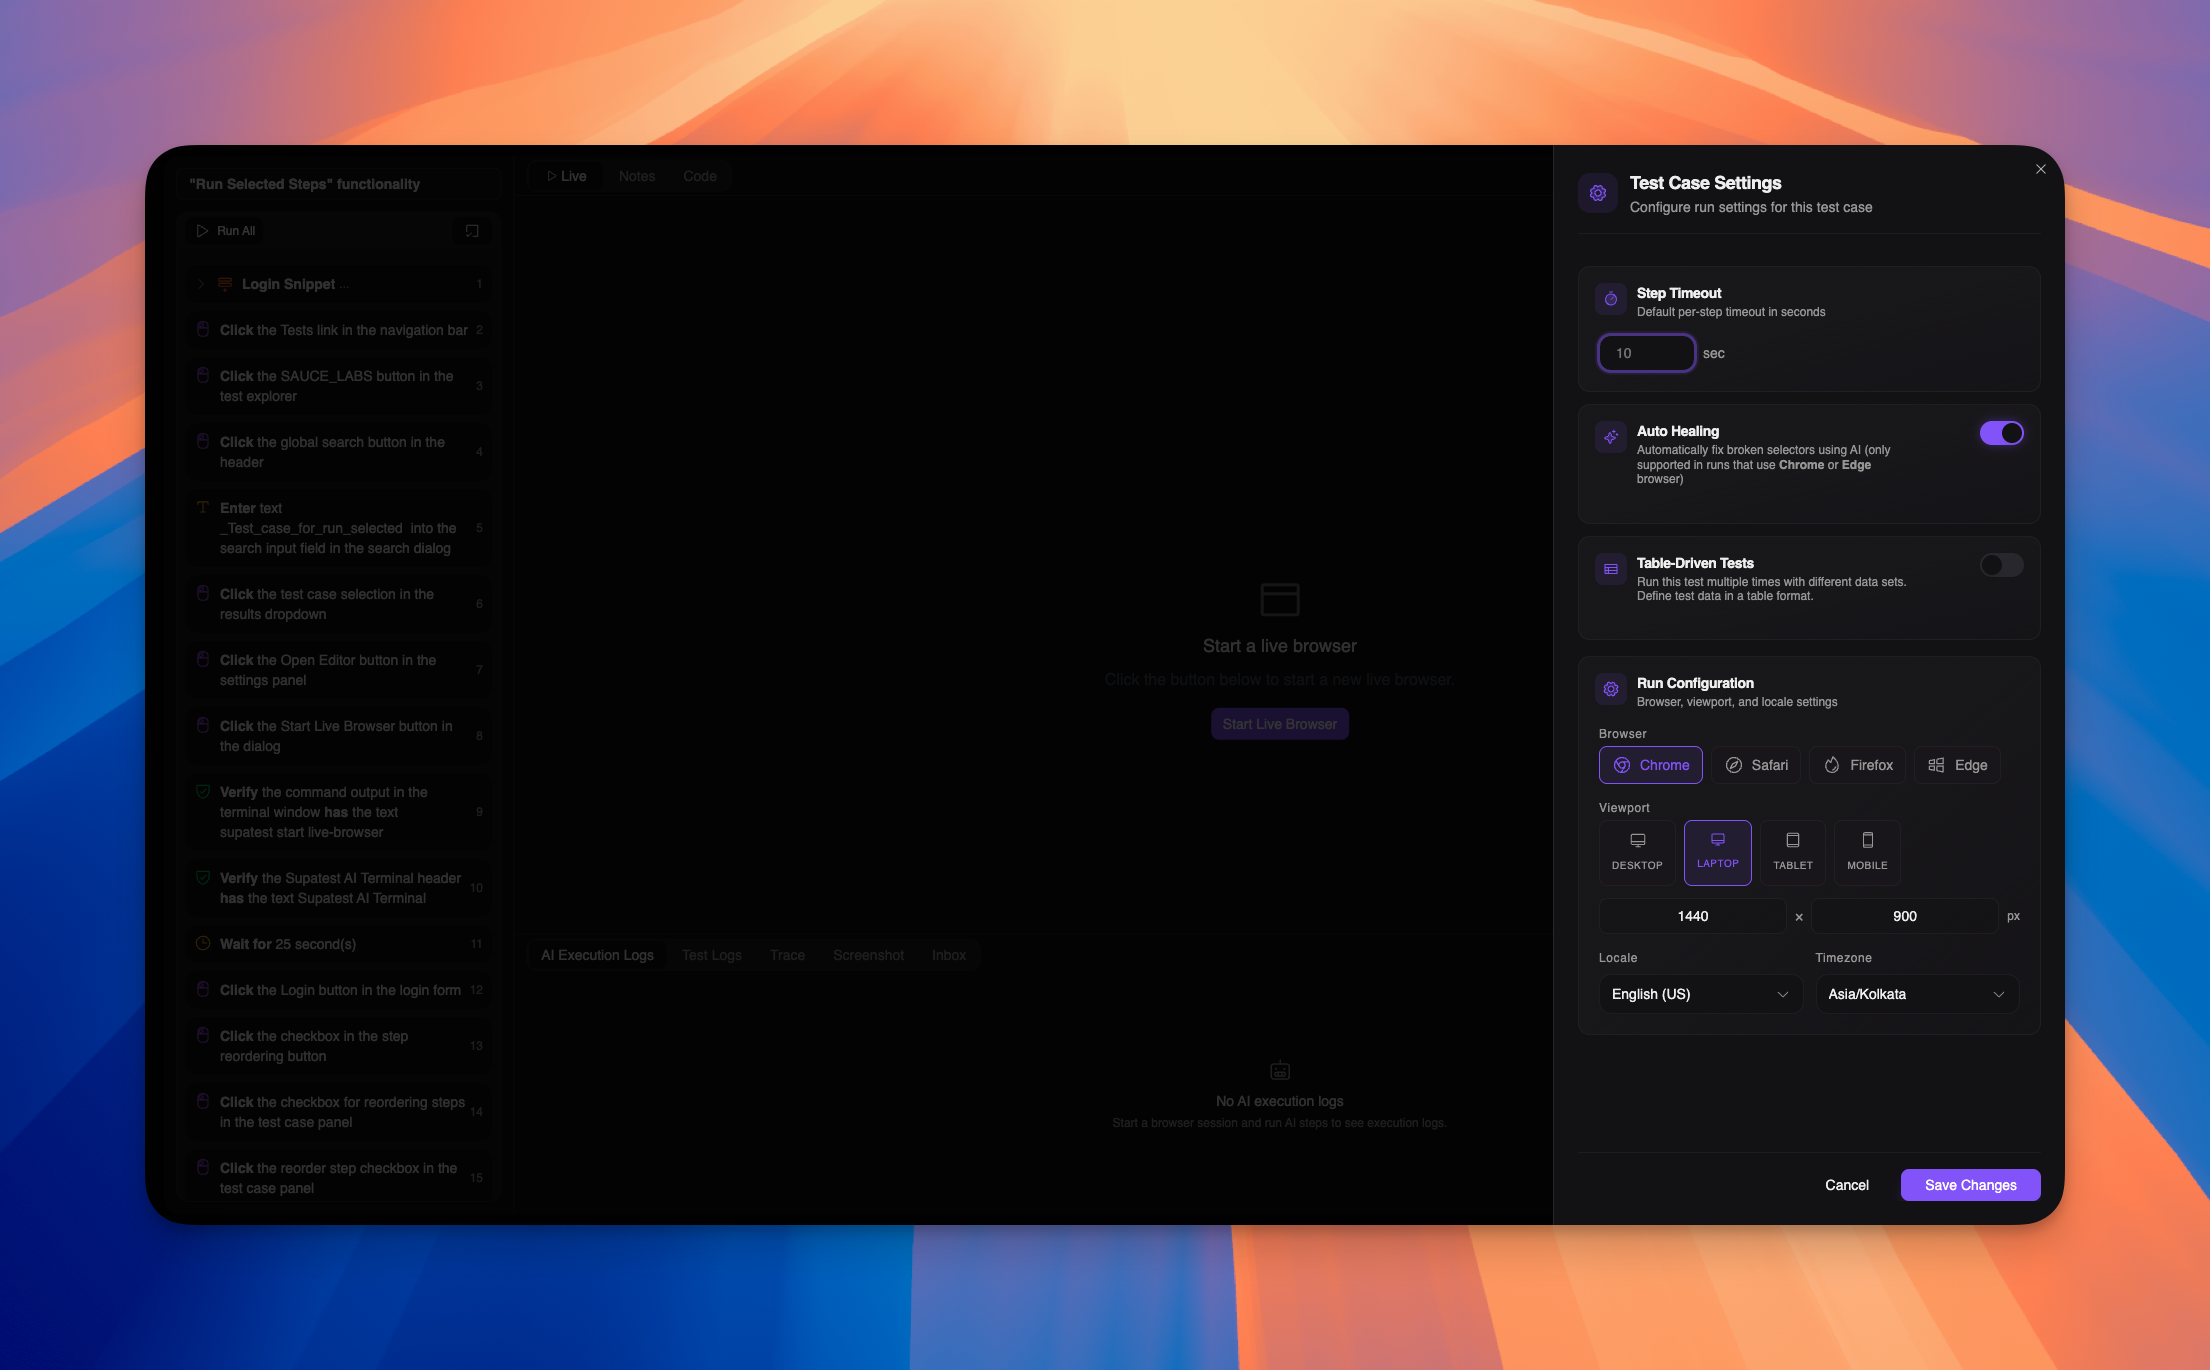
Step Timeout- Set the default timeout for individual steps in seconds
- Maximum value: 300 seconds (5 minutes)
- Falls back to system default if not specified
- Automatically fix broken selectors using AI
- Only supported in Chrome and Edge browsers
- Requires AI healing to be enabled in your environment
- Choose the browser for test execution: Chrome, Safari, Firefox, or Edge
- Default: Chrome
- Only one browser can be selected at a time
- Presets: Desktop, Laptop, Tablet, Mobile
- Custom: Manually specify width and height in pixels
- Default: 1440x900 pixels (large desktop)
- Configure the locale for the test run
- Options include: en-US, en-GB, fr-FR, and more
- Default: en-US
- Set the timezone for the test run
- Default: Asia/Kolkata
Central Area Tabs
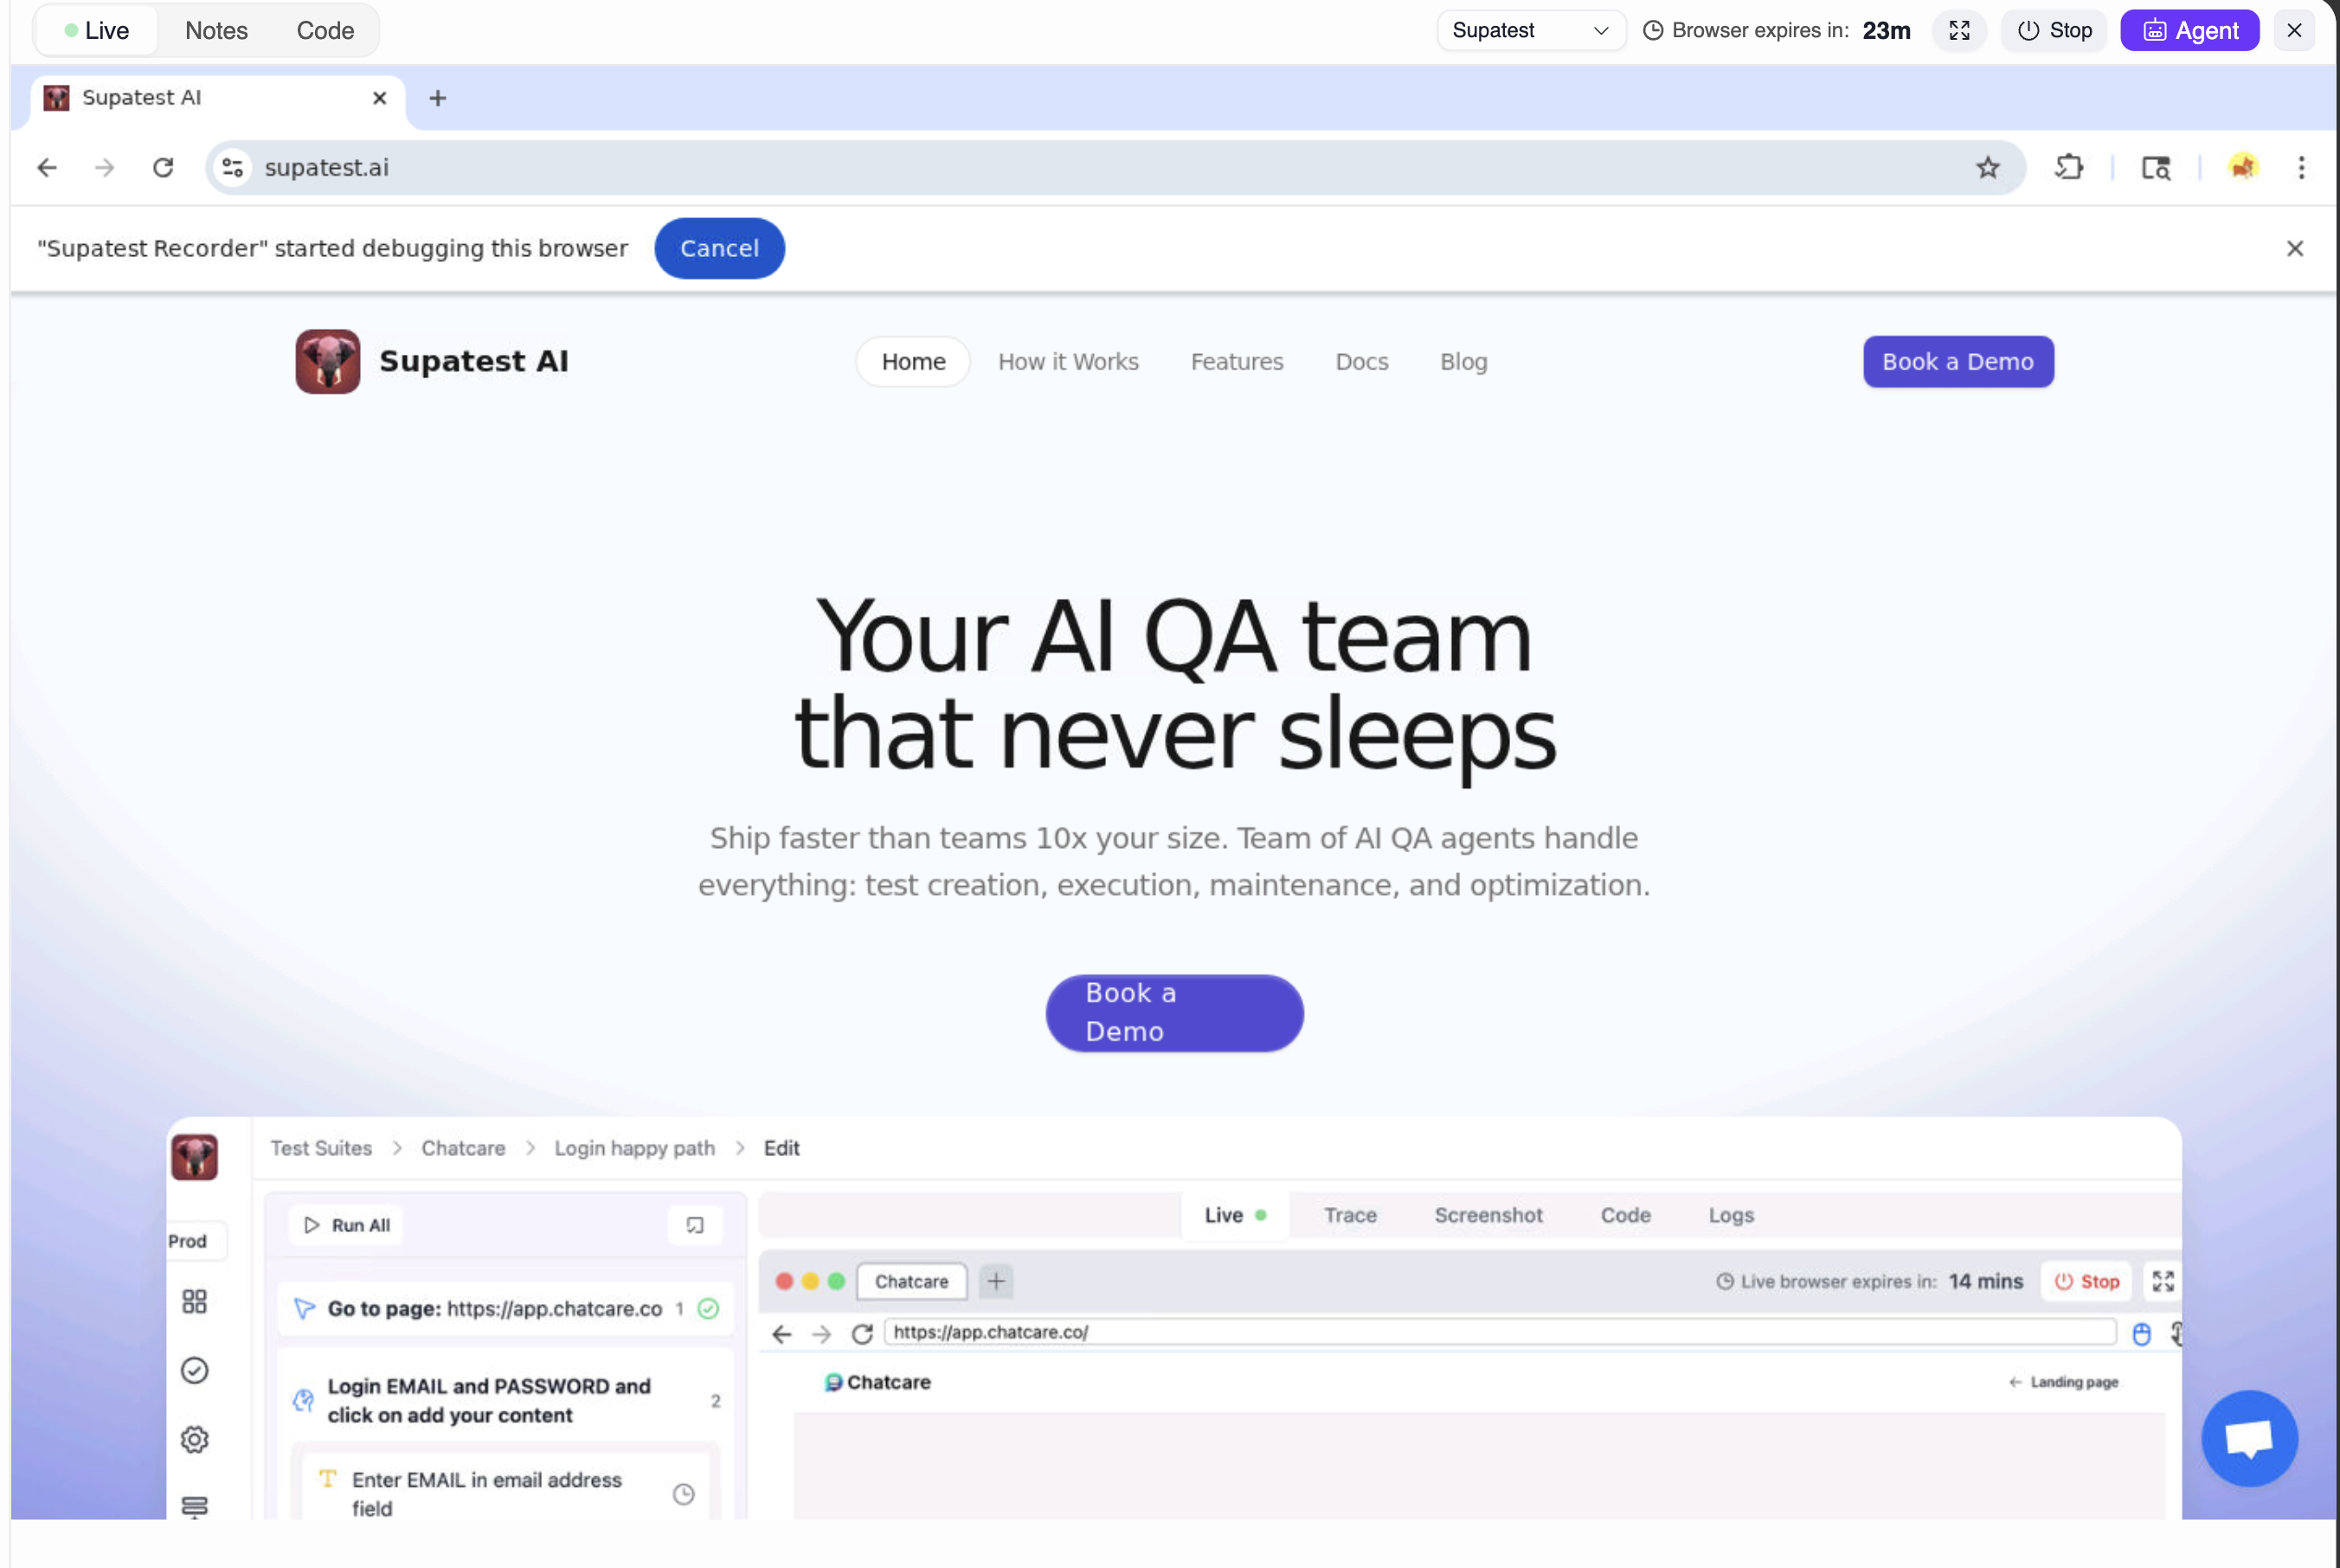
The central area above the console provides additional views:- Live: Watch the page as steps run; confirm navigations and state changes
- Notes: Add and view notes about the test case
- Code: View the generated code for the current steps
Live session
- Connection: a green pulse indicates an active live session; if disconnected, the editor attempts to reconnect
- Interaction: the live preview reflects each action; interaction may be restricted while the agent or a run is active
- Environment: runs use the environment selected in the sidebar; variables resolve at runtime
Editor Console
The Editor Console is located at the bottom of the editor and displays all assets and information from the last test run executed in the editor. This console consolidates execution data, making it easy to review results without leaving the editor.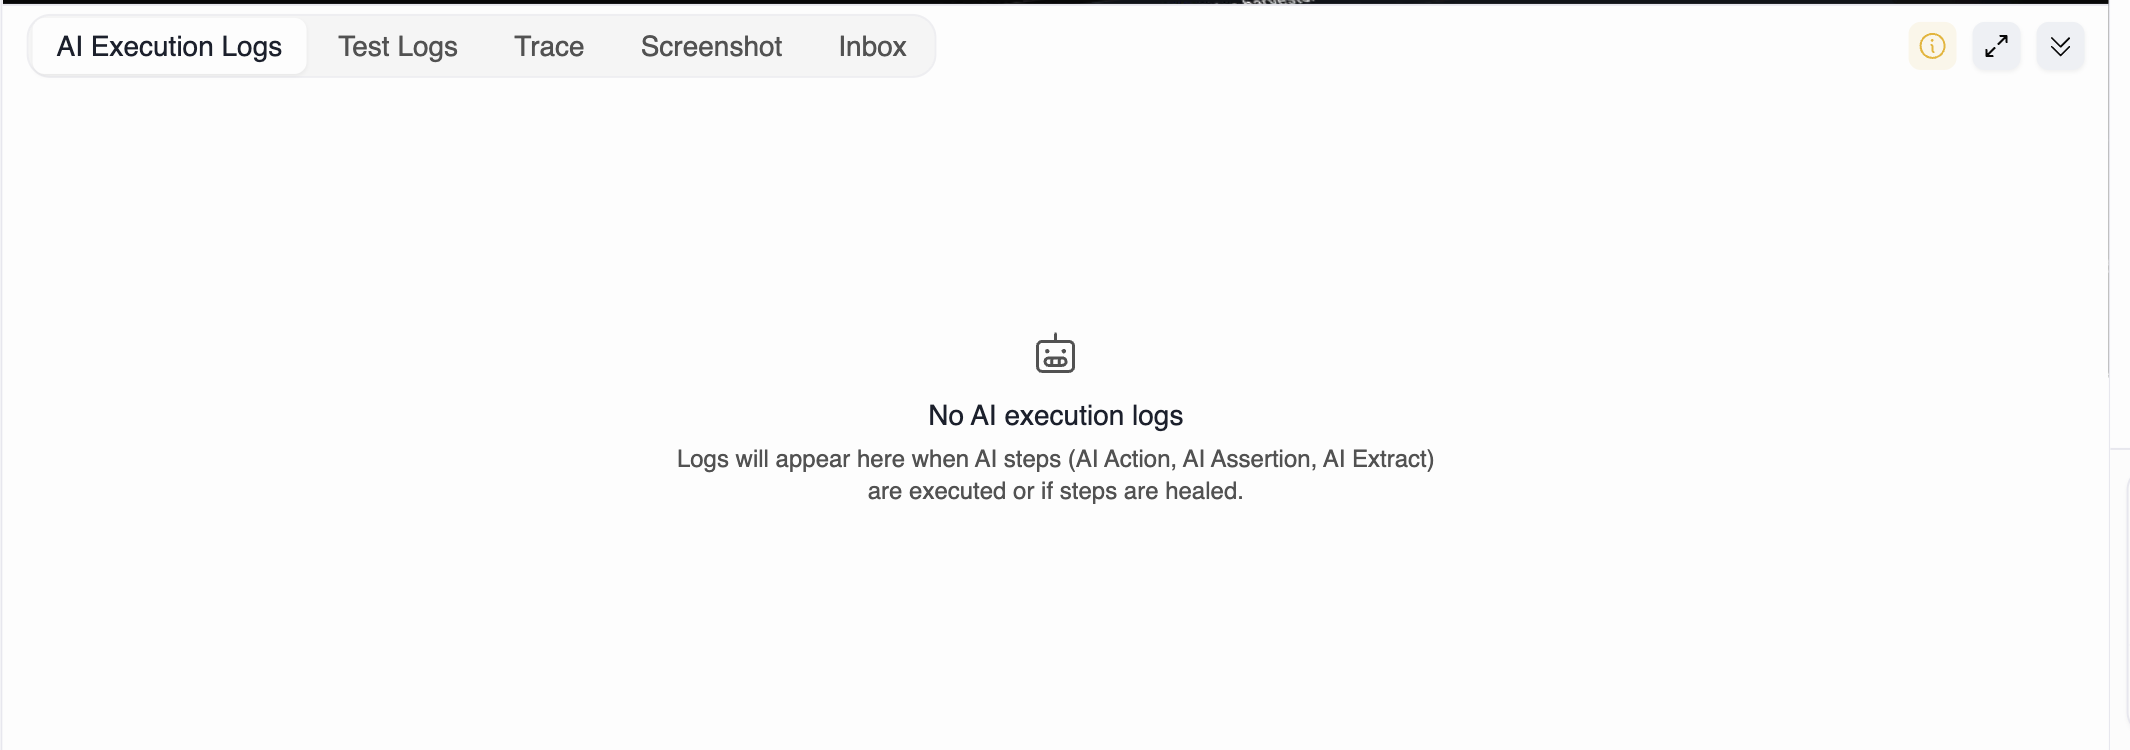
Console Tabs
The Editor Console includes the following tabs:- AI Execution Logs: View detailed logs from AI-driven steps (AI Action, AI Assertion, AI Extract) and auto-healing actions. Shows what the AI agent did during test execution and why.
- Test Logs: Traditional test execution logs with both AI-generated summaries and raw technical logs. Switch between readable AI summaries and detailed technical output.
- Trace: Detailed execution timeline showing actions, waits, network requests, and DOM snapshots. Use this to understand timing and correlate events.
- Screenshot: Step-aligned screenshots captured during execution. The quickest way to confirm what the page looked like at each step.
- Inbox: Emails and TOTP codes received during test execution. View email content, extract verification codes, and access links from emails captured by Check Email or Get TOTP steps.
Note: The Editor Console only shows data from runs executed within the editor. For historical runs and analytics, see the test case’s Runs tab or Last Run Report tab.
Action Agent
The Action Agent panel is located on the right side of the editor. It provides a chat interface to interact with the AI Action Agent, which can perform actions in the live browser based on your instructions.
Using the Action Agent
- Expand the panel: Click on the Action Agent tab on the right edge to expand it
- Enter instructions: Type natural language commands describing what you want to do
- Watch execution: The agent performs actions in the live browser in real-time
- Review results: Steps are created automatically as the agent performs actions
Troubleshooting
- Disconnected live session: wait for auto-reconnect or reset session
- Step stuck running: cancel the run, then reset session and try again
- No screenshots: ensure the run completed or the step actually executed
- Logs empty: re-run; open Raw Logs after execution completes


