Overview
The Supatest Recorder transforms your natural browser interactions into automated steps. Using an intelligent recording toolbar that appears in your live browser, you can capture user actions, assertions, and complex workflows with precision and ease.Prerequisites
- Valid starting URL or reference snippet
- Active live browser session
- Stable internet connection (recommended: >30 Mbps)
Getting Started with Recording
Starting a Recording Session
- Open a test case in the editor
- Initialize Live Browser so it’s active and connected
- Click Record in the editor
- The recording toolbar appears in your browser
The Recording Toolbar
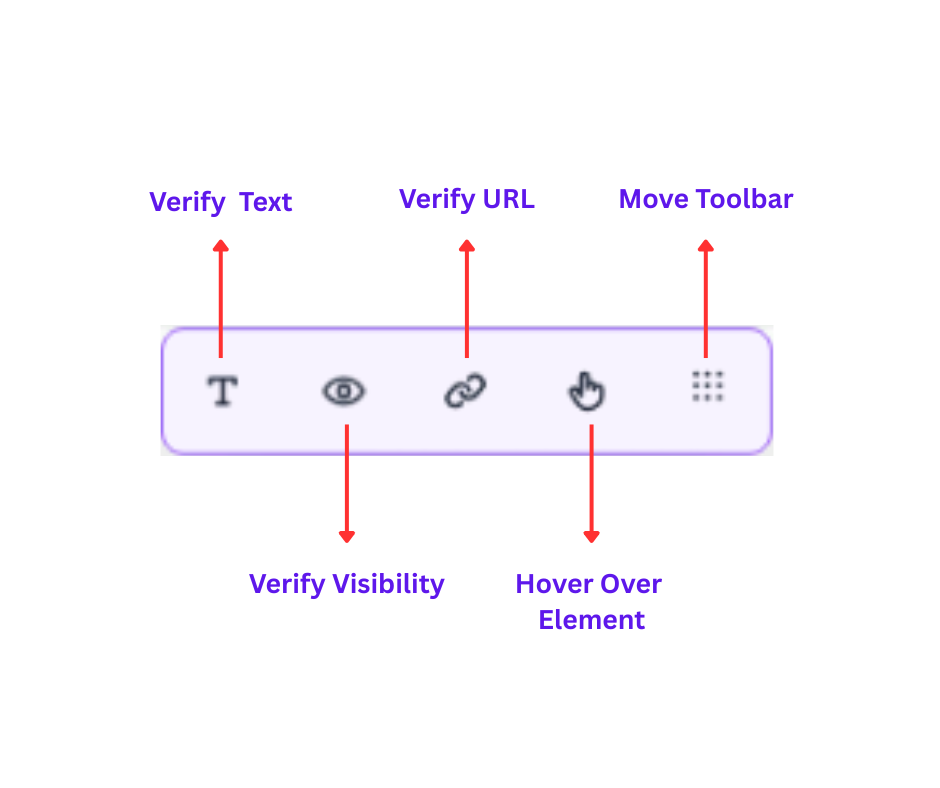
When recording begins, a comprehensive toolbar appears in your browser with the following controls:
Toolbar Controls
| Control | Function | Description | Shortcut |
|---|---|---|---|
| Verify Text | Text assertion | Toggle to add text verification assertions | Ctrl+1 |
| Verify Visibility | Element visibility | Verify element visibility state | Ctrl+2 |
| Verify URL | URL assertion | Verify current page URL matches expectation | Ctrl+3 |
| Hover Mode | Hover activation | Toggle hover recording mode | Ctrl+4 |
| Move Toolbar | Reposition | Drag to move toolbar position | - |
Keyboard Shortcuts
Use these keyboard shortcuts to quickly toggle recording modes without clicking the toolbar:Ctrl+1- Toggle Verify Text modeCtrl+2- Toggle Verify Visibility modeCtrl+3- Verify current URL immediatelyCtrl+4- Toggle Hover mode
- When the toolbar is blocked by popups or overlays
- For faster workflow when recording many assertions
- To avoid interfering with page interactions
Toolbar Positioning
- Moveable: Drag via the move handle
- Non-intrusive: Avoids interfering with your app
- Always accessible: Stays visible during recording
Implicit Recording (Automatic Capture)
The recorder automatically captures these user interactions:Mouse Actions
- Single left clicks, right clicks and double clicks
- Scrolling
- Select option from a native select element
- Drag and drop (native HTML5)
Input Actions
- Text entry in inputs, textareas, and contenteditable elements
- Checkbox/radio selections and dropdown choices
- Individual key presses like Enter, Ctrl, etc.
- Combinational key presses like Cmd/Ctrl + Shift, etc.
Explicit Recording (Manual Actions)
Some actions require manual activation in the toolbar:Hover Interactions
- Activate Hover mode
- Hover the target element
- Click to capture the hover action
- Deactivate Hover mode
Assertions and Validations
- Text verification via Verify Text
- URL verification via Verify URL
- Visibility checks via Verify Visibility
Tab Management During Recording
Switch Tab Behavior
Tab switching requires manual action in the live browser:- Physically click the new tab in the browser
- Recorder detects the switch
- A Switch Tab step is added automatically
- Tabs are auto-named (tab_1, tab_2) or can be renamed
Recording Highlighter
- Highlights interactive elements
- Captures screenshots per action
- Helps identify recordable elements
Advanced Recording Features
- Selector optimization
- Multi selector capture
- Step description generation
Chrome Debugger Banner
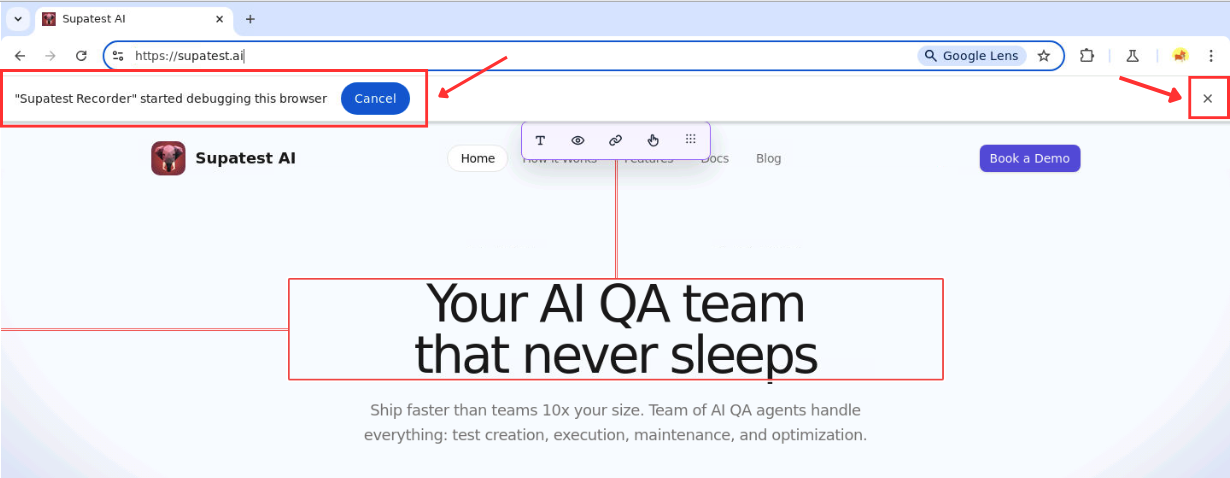
When recording starts, you may see a Chrome debugger banner at the top of your browser:
⚠️ Critical: Do Not Dismiss the Debugger Banner
NEVER click “Cancel” or the ”×” close button on the Chrome debugger banner. This will:- Break the recorder completely - Recording will stop working
- Require browser restart - You’ll need to refresh the page and restart recording
- Lose current session - Any unsaved recording progress will be lost
What to do instead:
- Leave the banner visible - It doesn’t interfere with recording
- Ignore the warning - It’s safe to continue using the page normally
- Move the toolbar - Drag the recording toolbar to a different position if needed
Troubleshooting
- Check live browser connection if recording won’t start
- Ensure proper test case setup and WebSocket connectivity
- Use the element picker for precise selection
- Review automatic wait detection if steps are missing
- If recording stops working: Check if the Chrome debugger banner was dismissed - restart the browser if needed

