Create a Run lets you execute any combination of test cases on-demand. Pick individual tests, select entire folders, or reuse a previous run’s test selection - all from a single dialog.Documentation Index
Fetch the complete documentation index at: https://docs.supatest.ai/llms.txt
Use this file to discover all available pages before exploring further.
This feature was previously known as Plan Runs. It has been renamed to Grouped Runs to reflect its expanded scope - you can now create runs independently, without needing a test plan. Grouped Runs encompasses both scheduled test plan runs and ad-hoc runs you create manually.
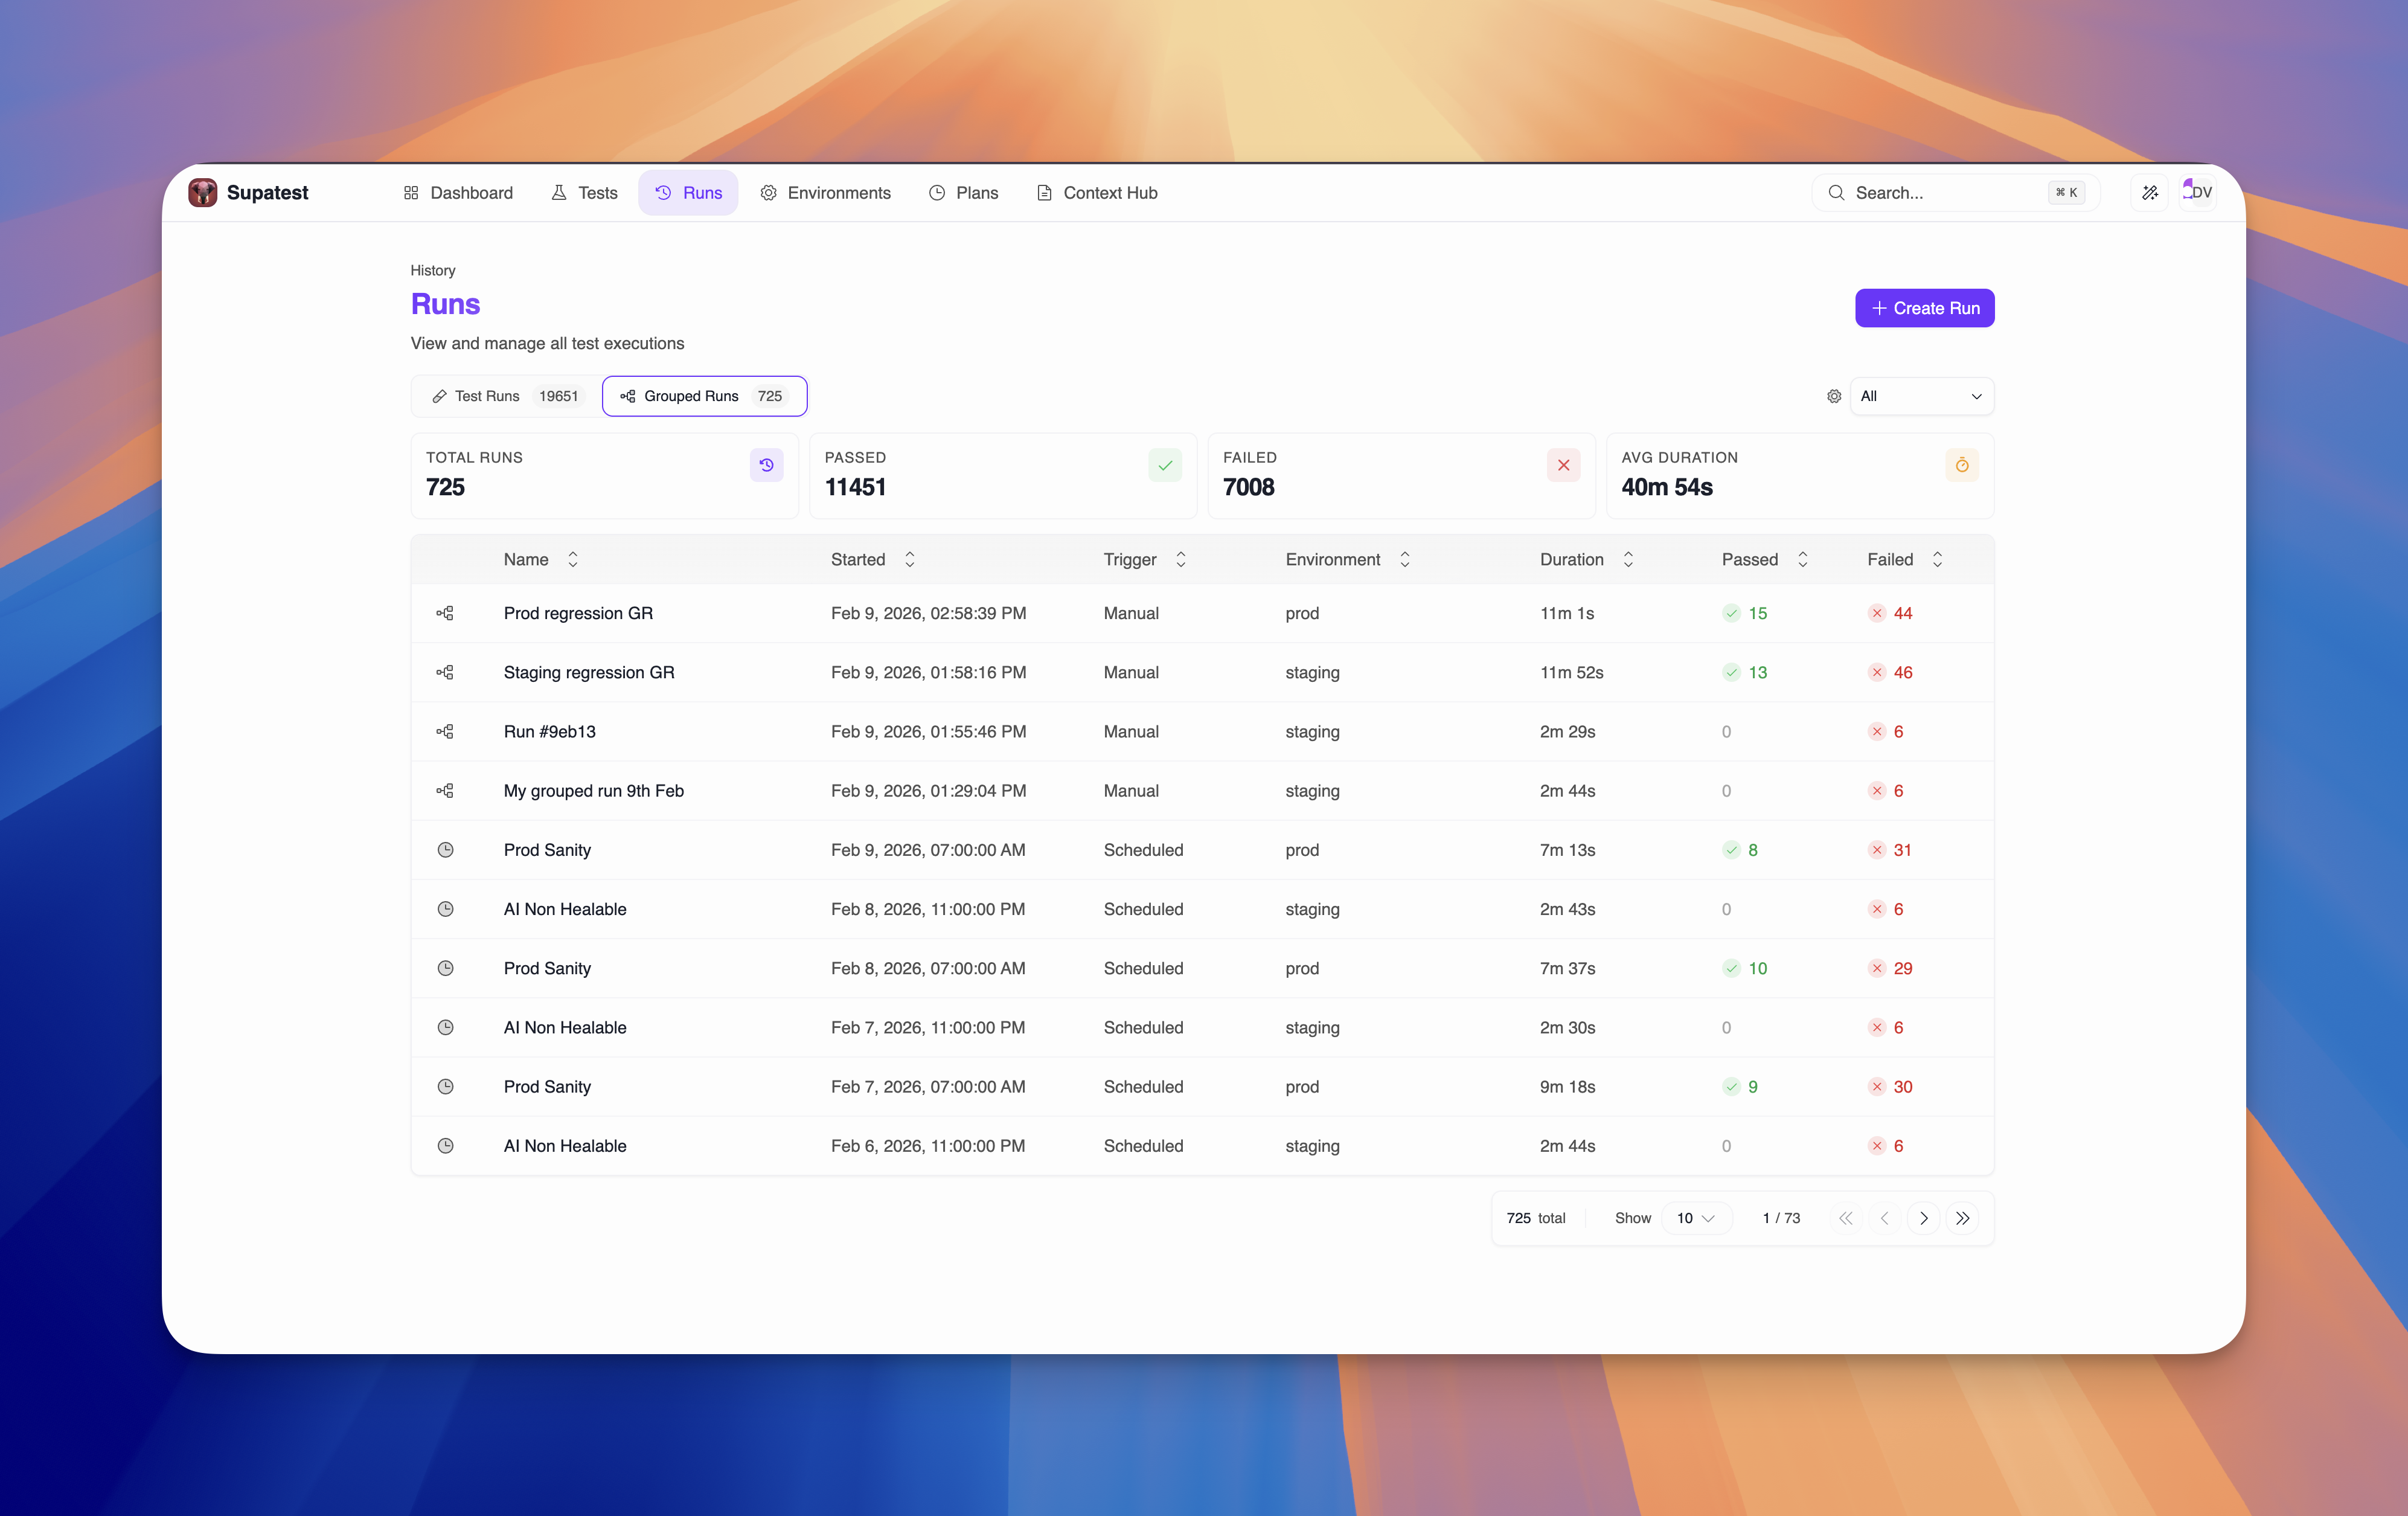
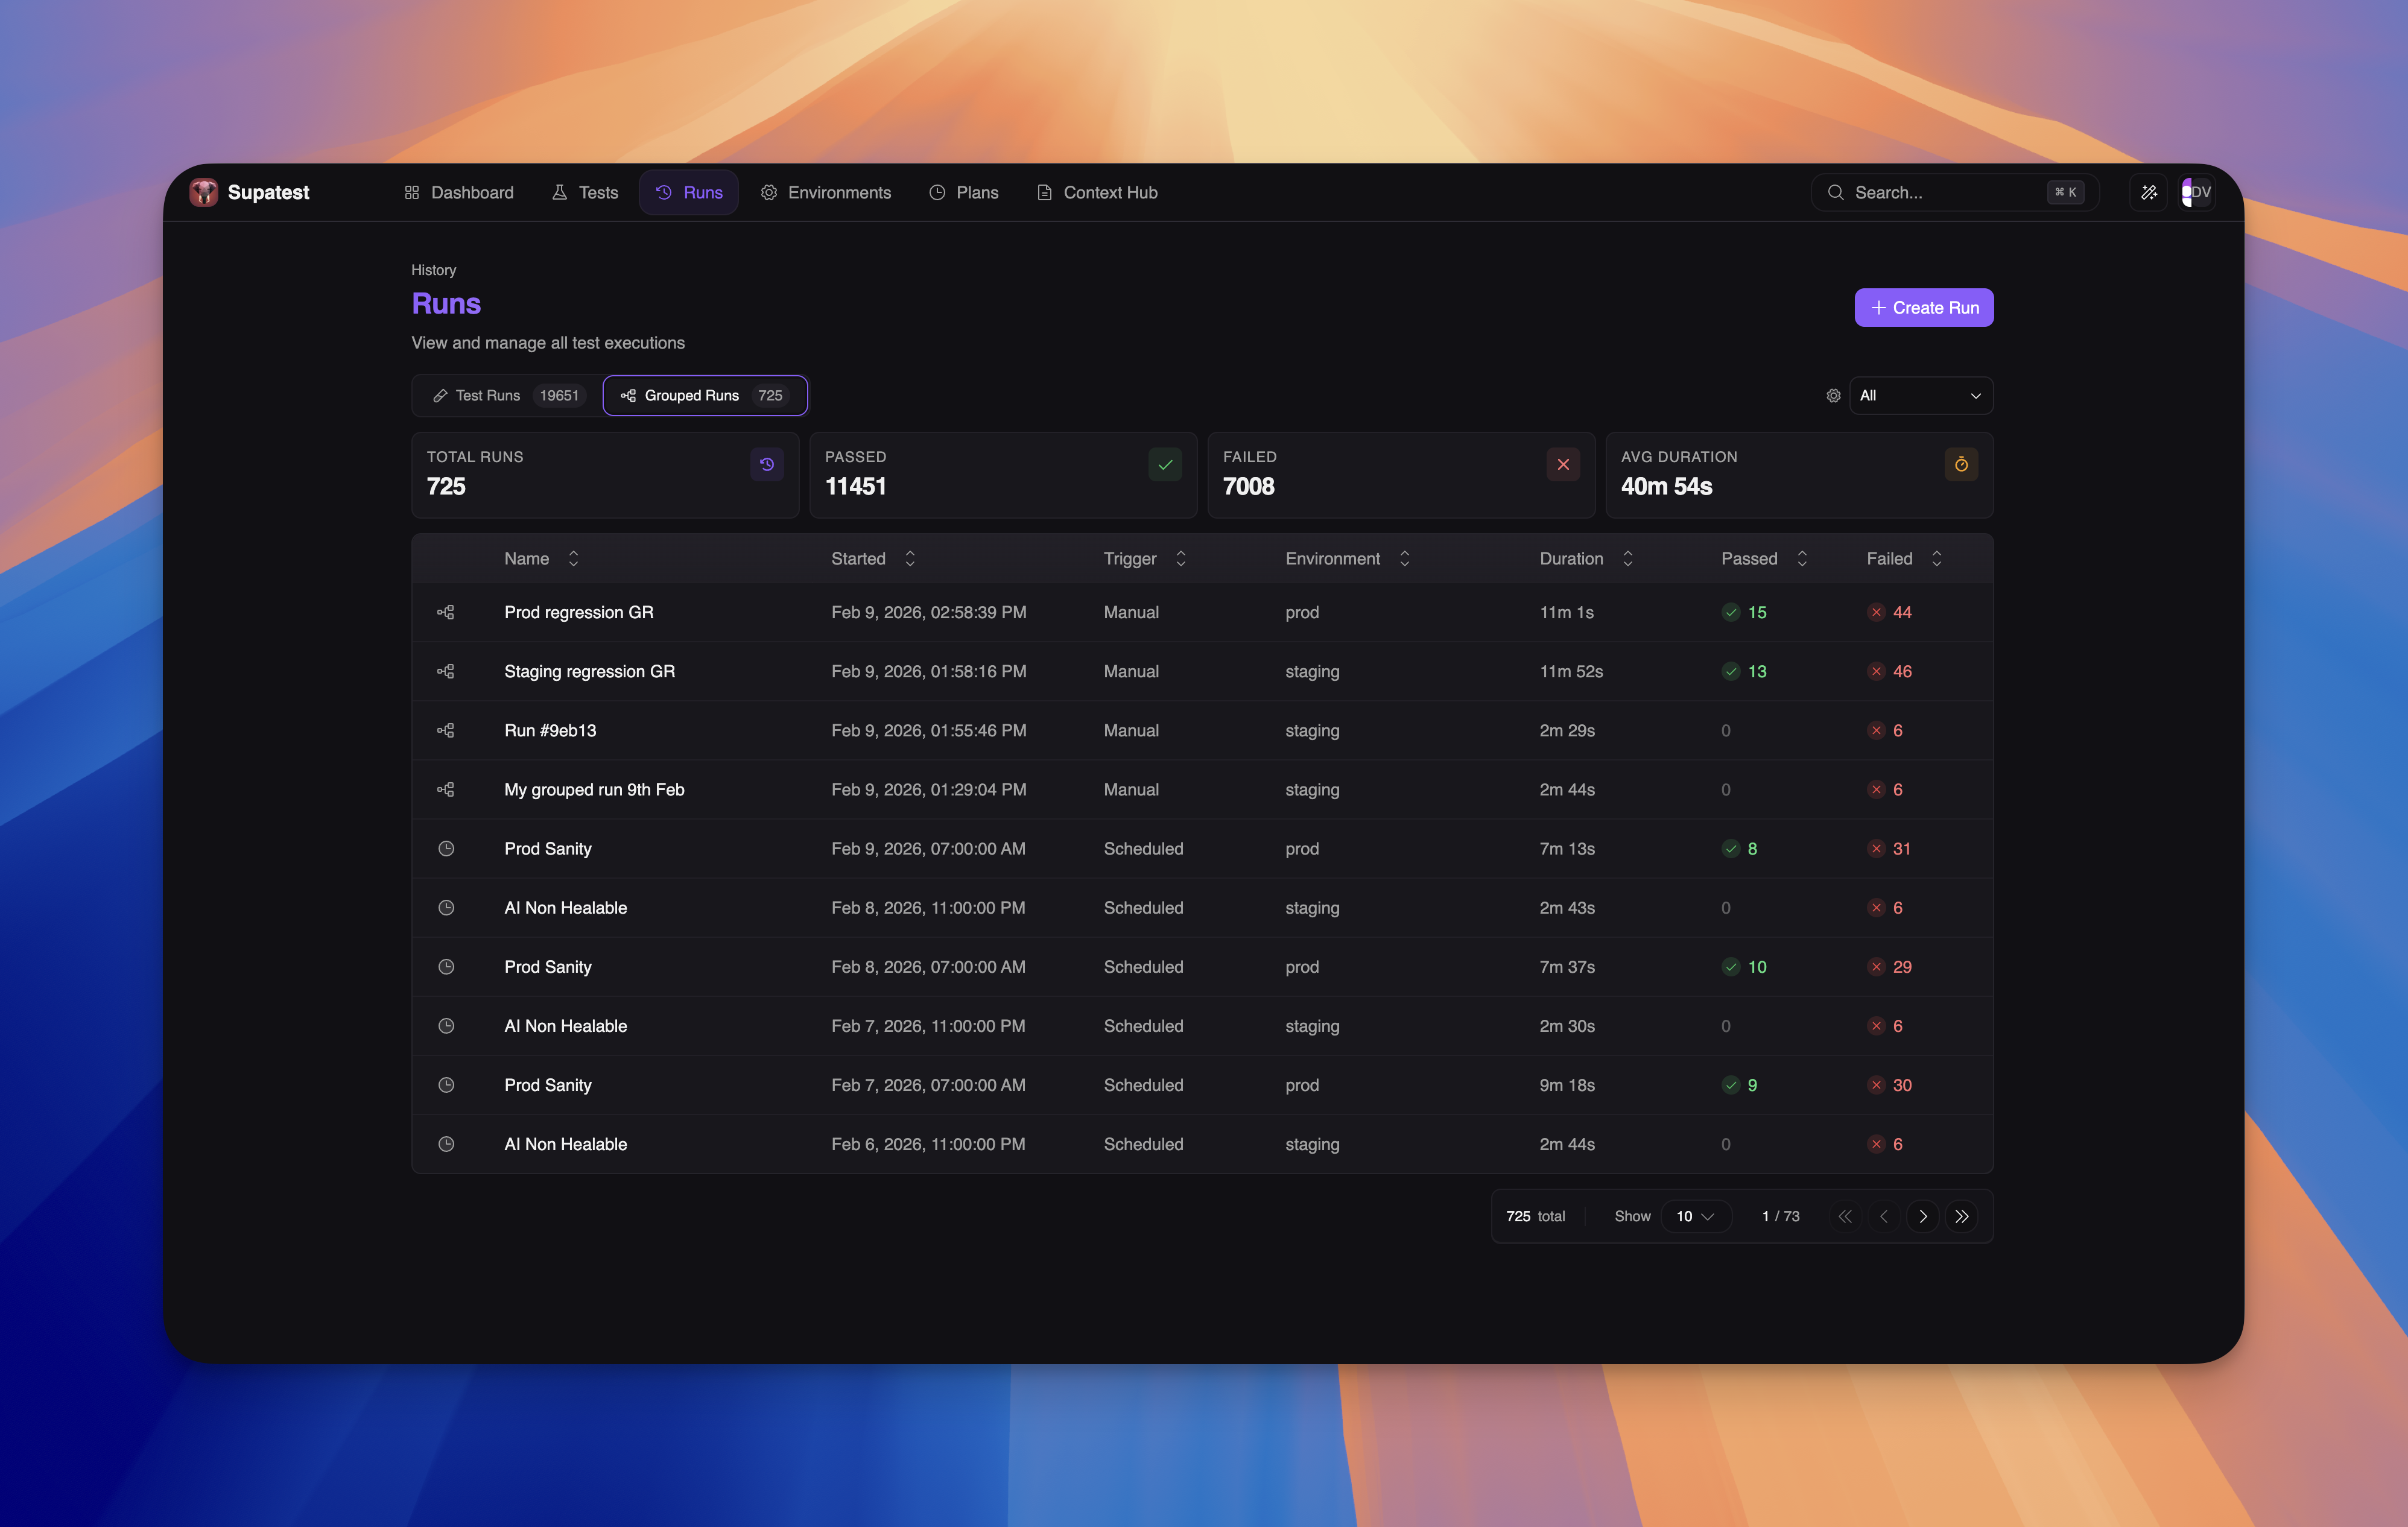
The Runs Page
The Runs page is the central hub for all test executions. It has three tabs:| Tab | Description |
|---|---|
| Test Runs | Unified run history for both standard test runs and scenario runs |
| Grouped Runs | Batched runs - both manually created and scheduled test plan runs |
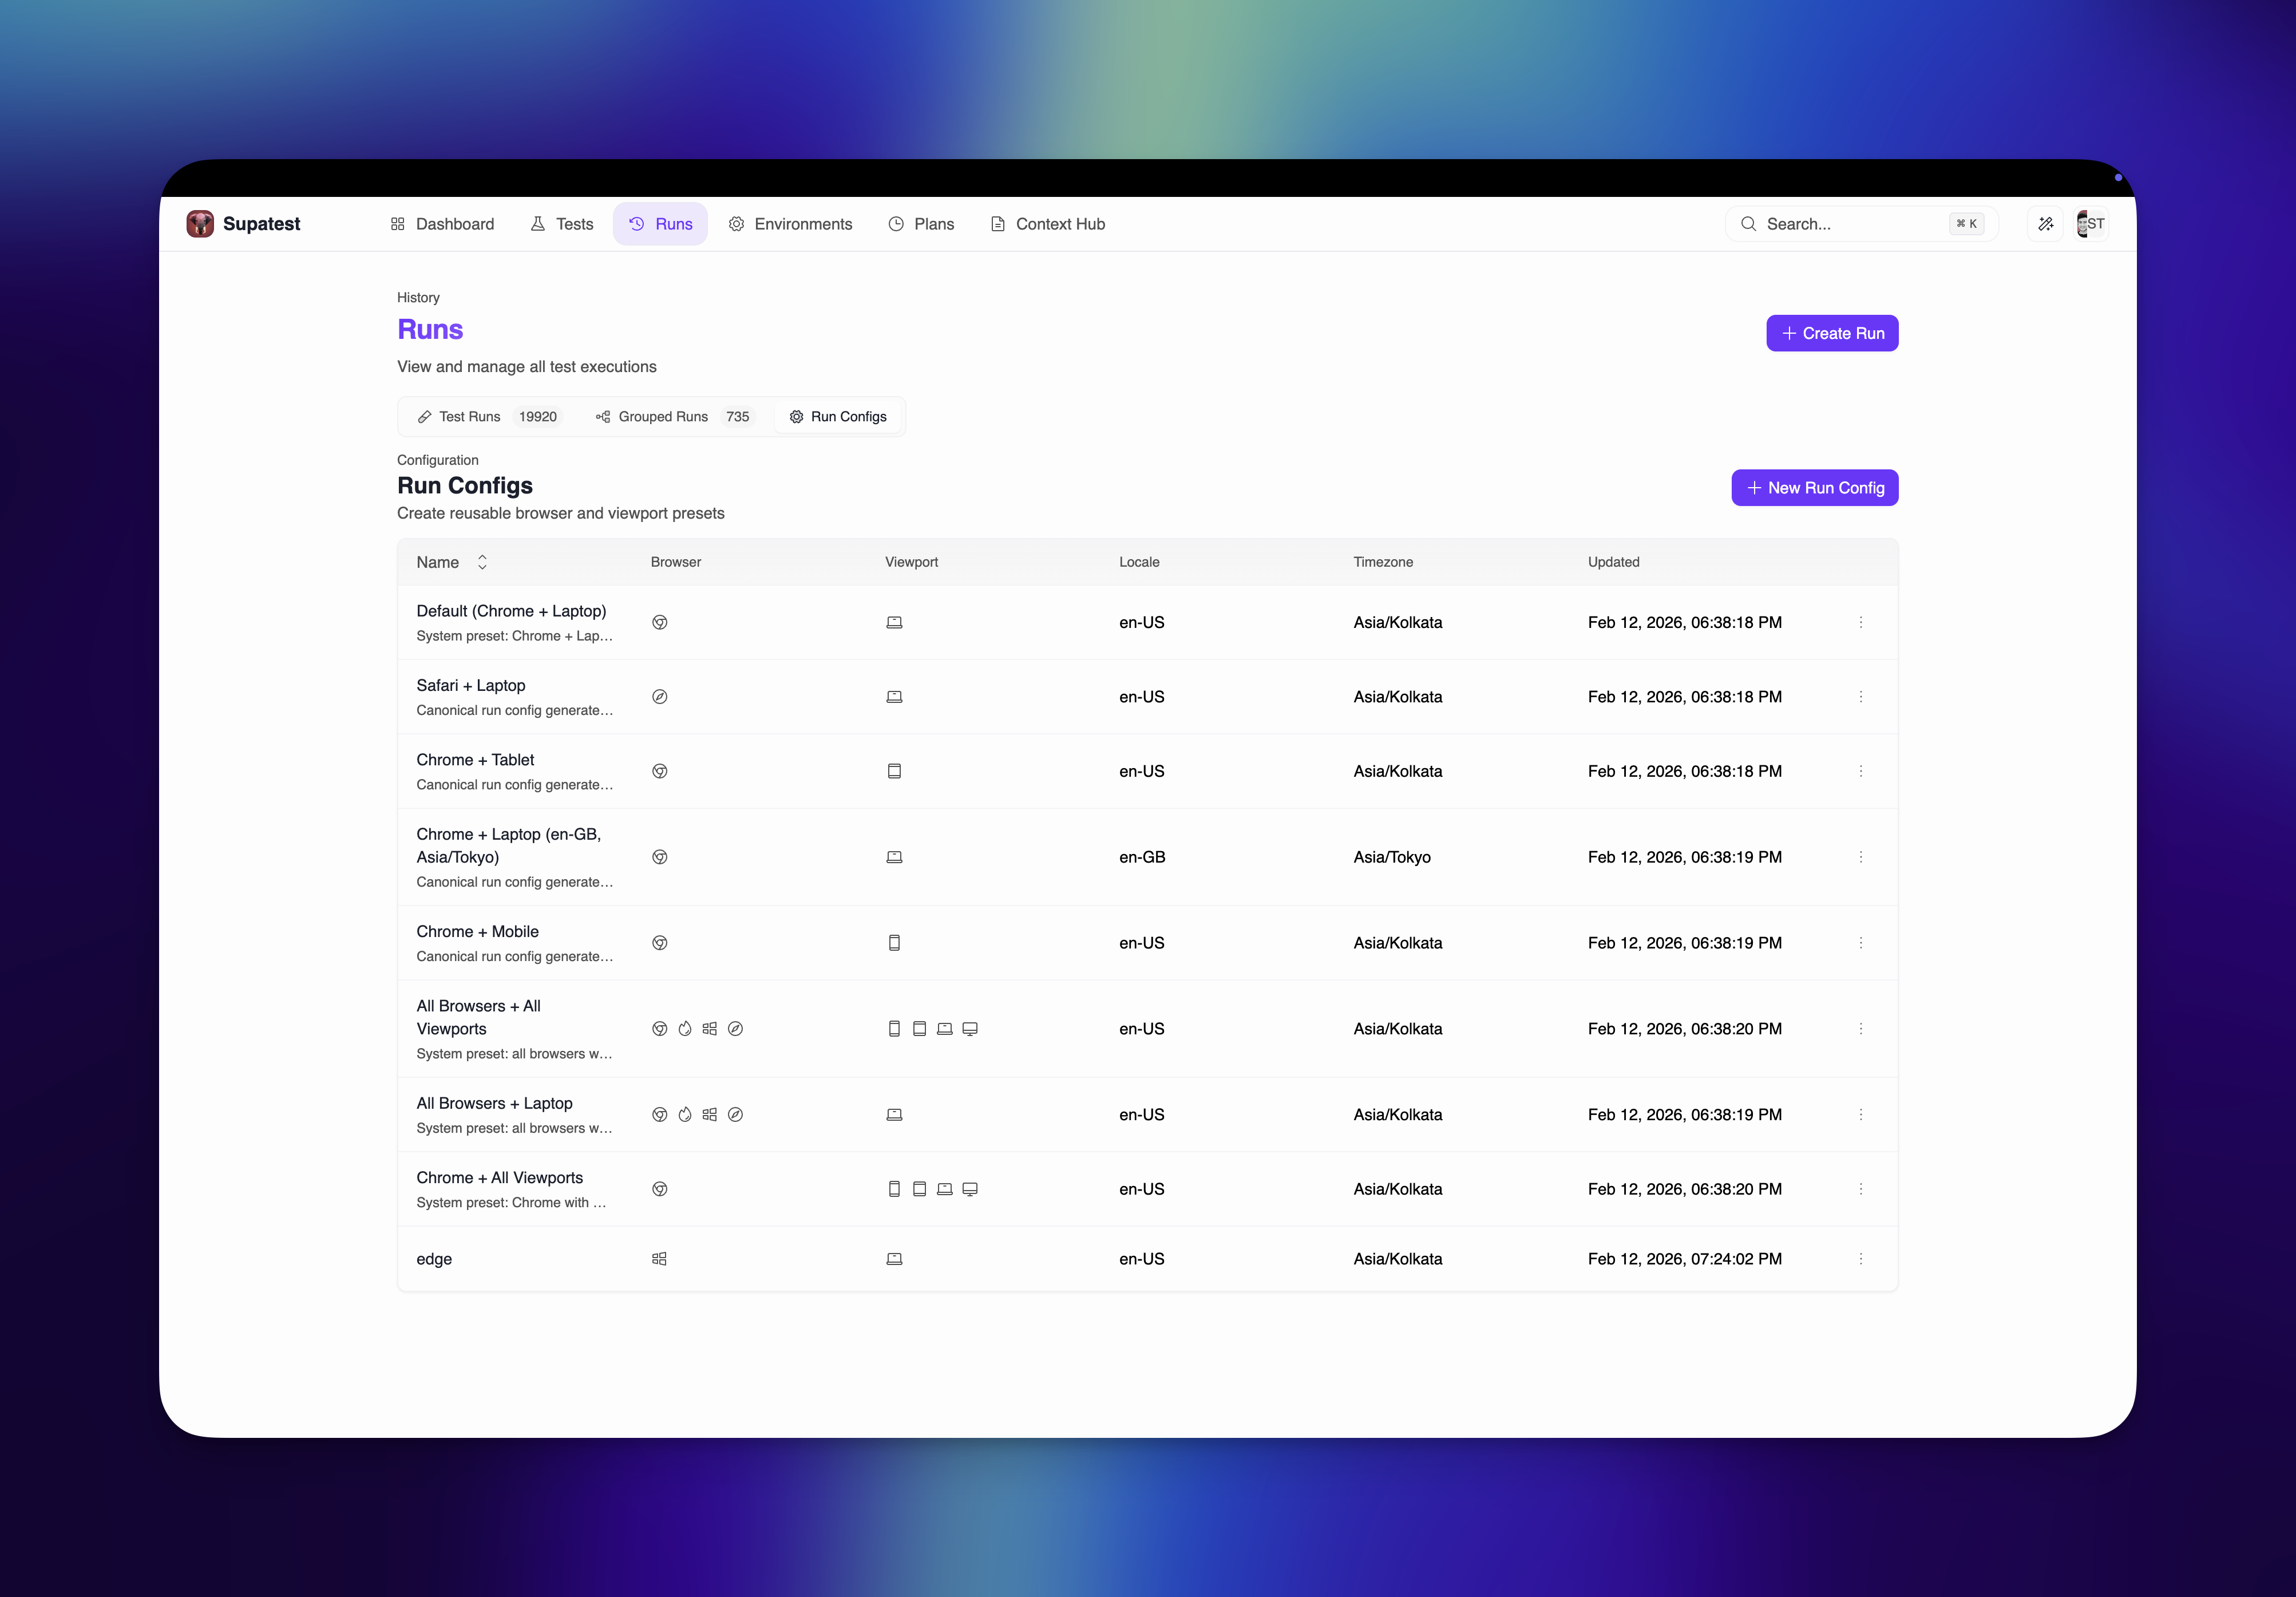
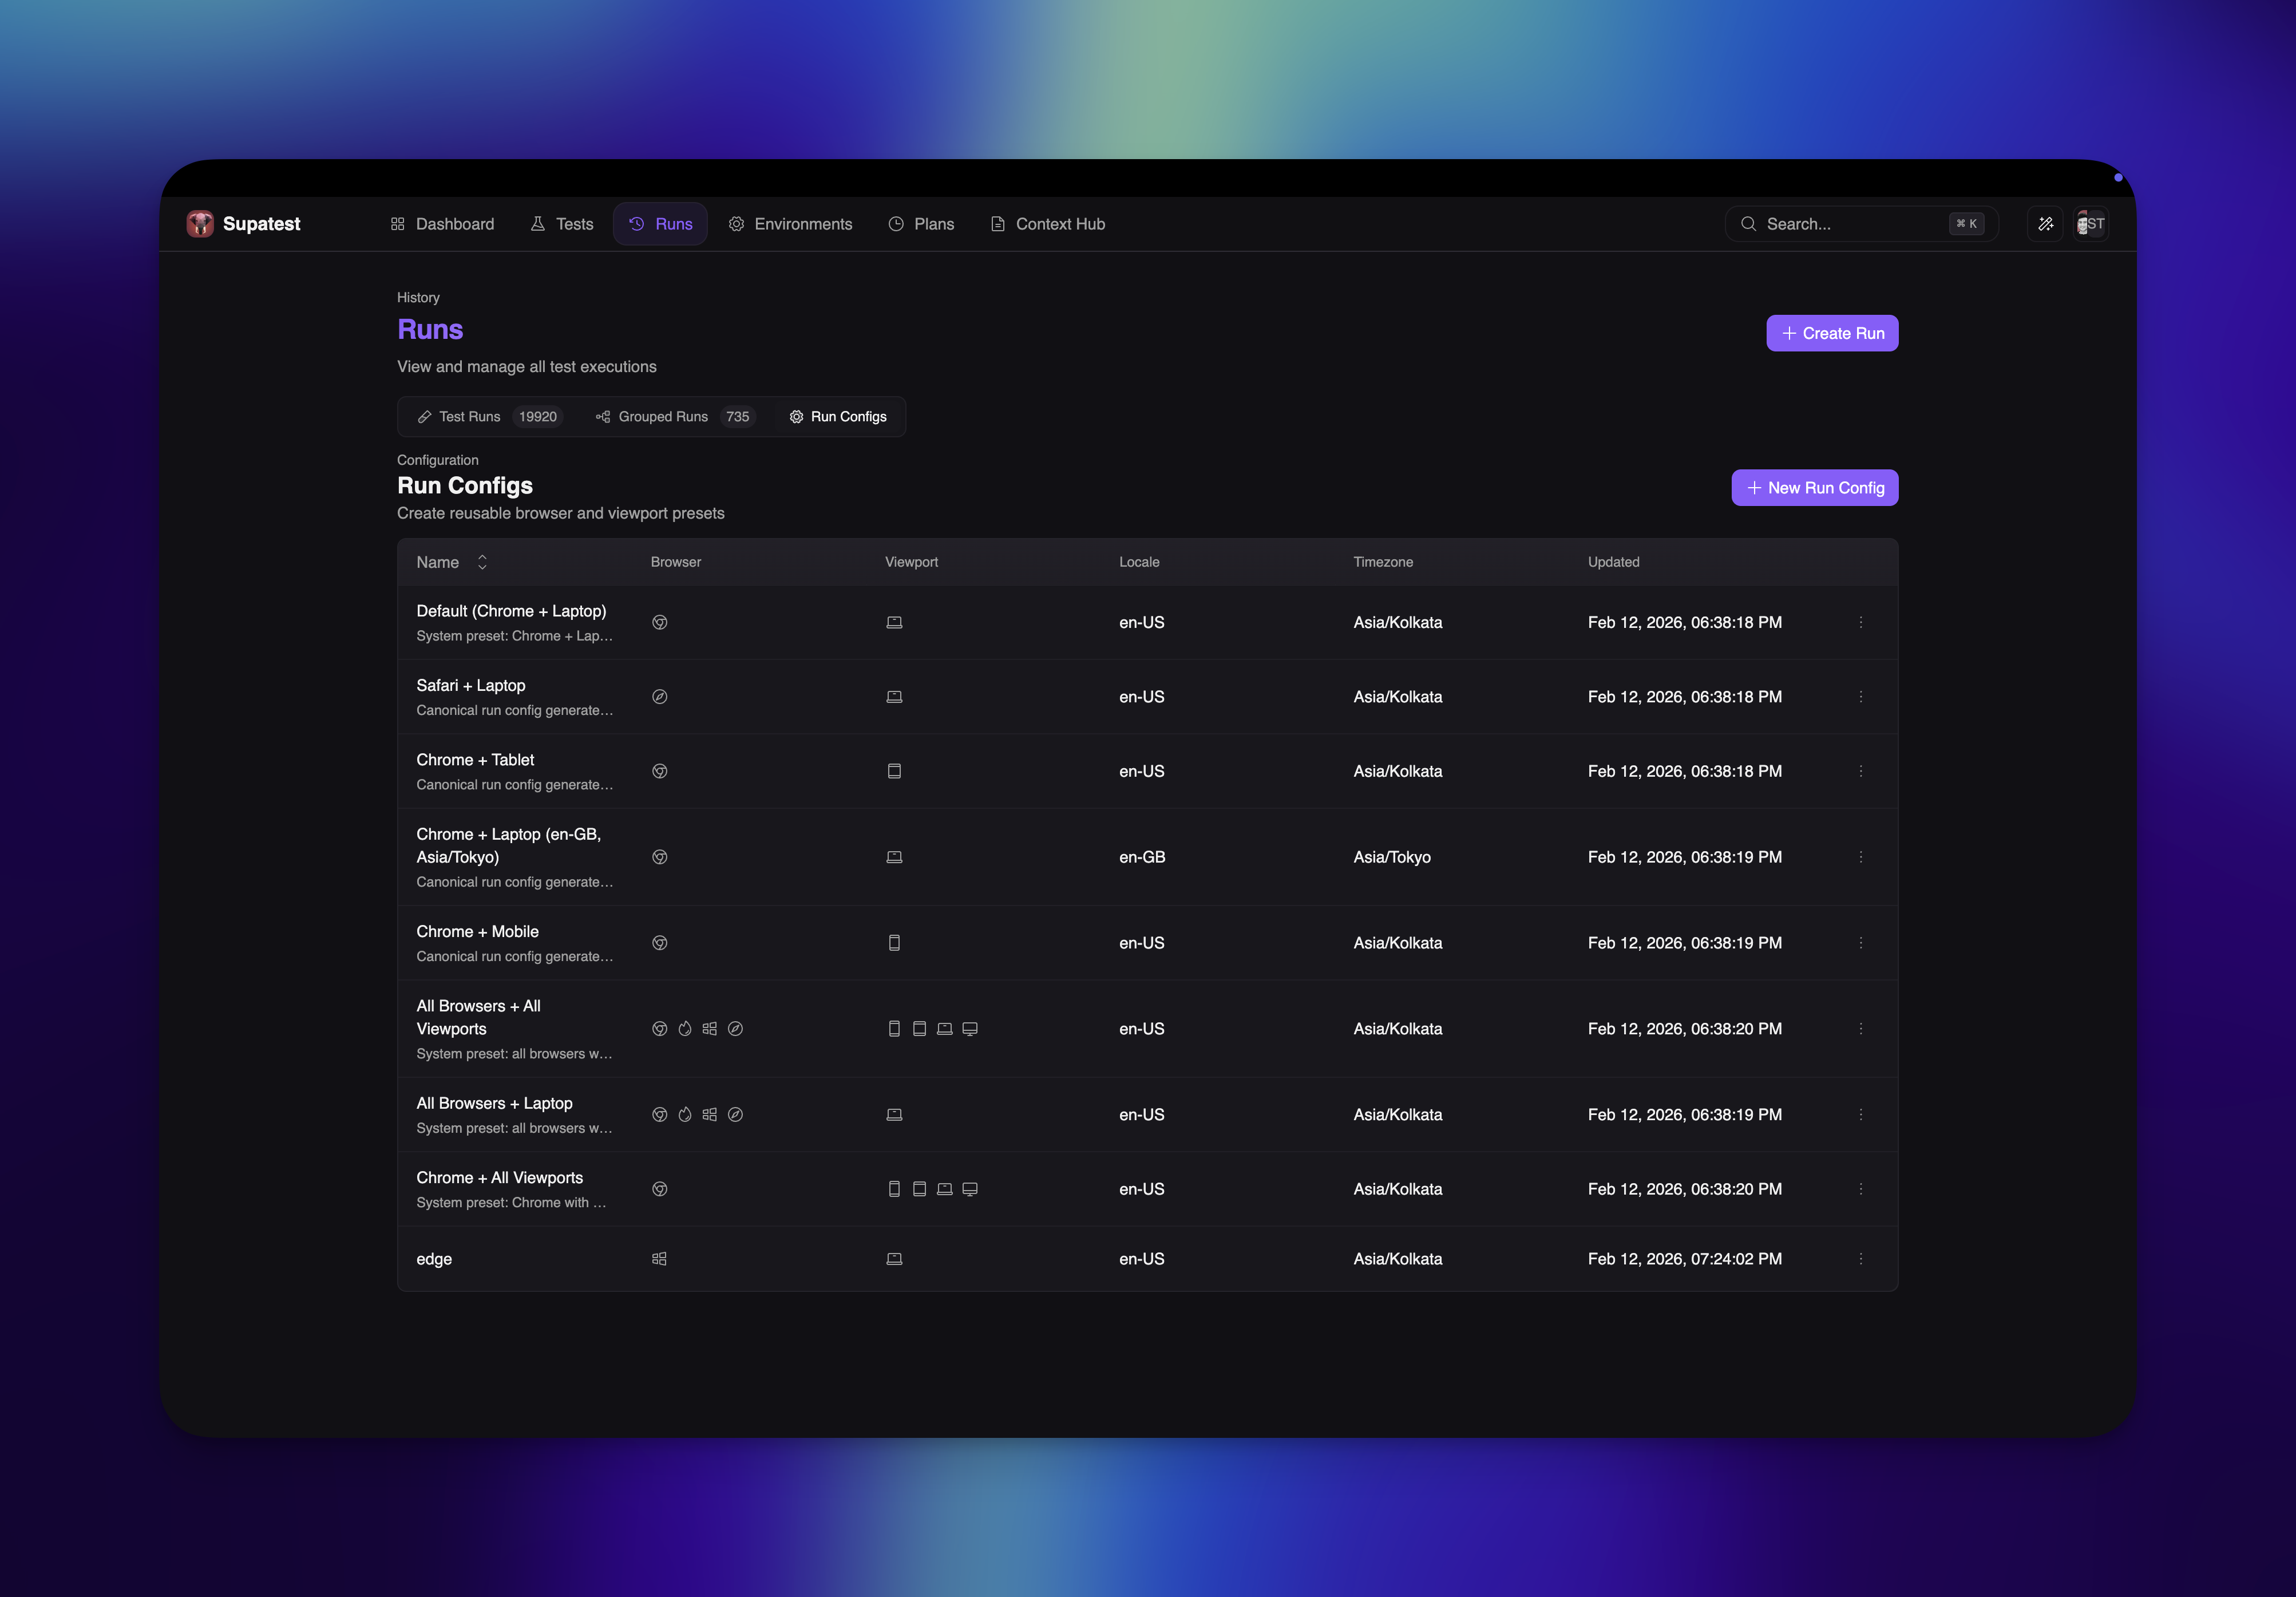
| Run Configs | Create, edit, and archive reusable run configurations |
Run Configs Tab
The Run Configs tab in the Runs page is where reusable execution profiles are managed.- Create named configs for browser + viewport combinations
- Set locale and timezone defaults per config
- Reuse the same config across test cases, test plans, and ad-hoc runs
Create Run Dialog
The Create Run dialog lets you configure and launch a new run.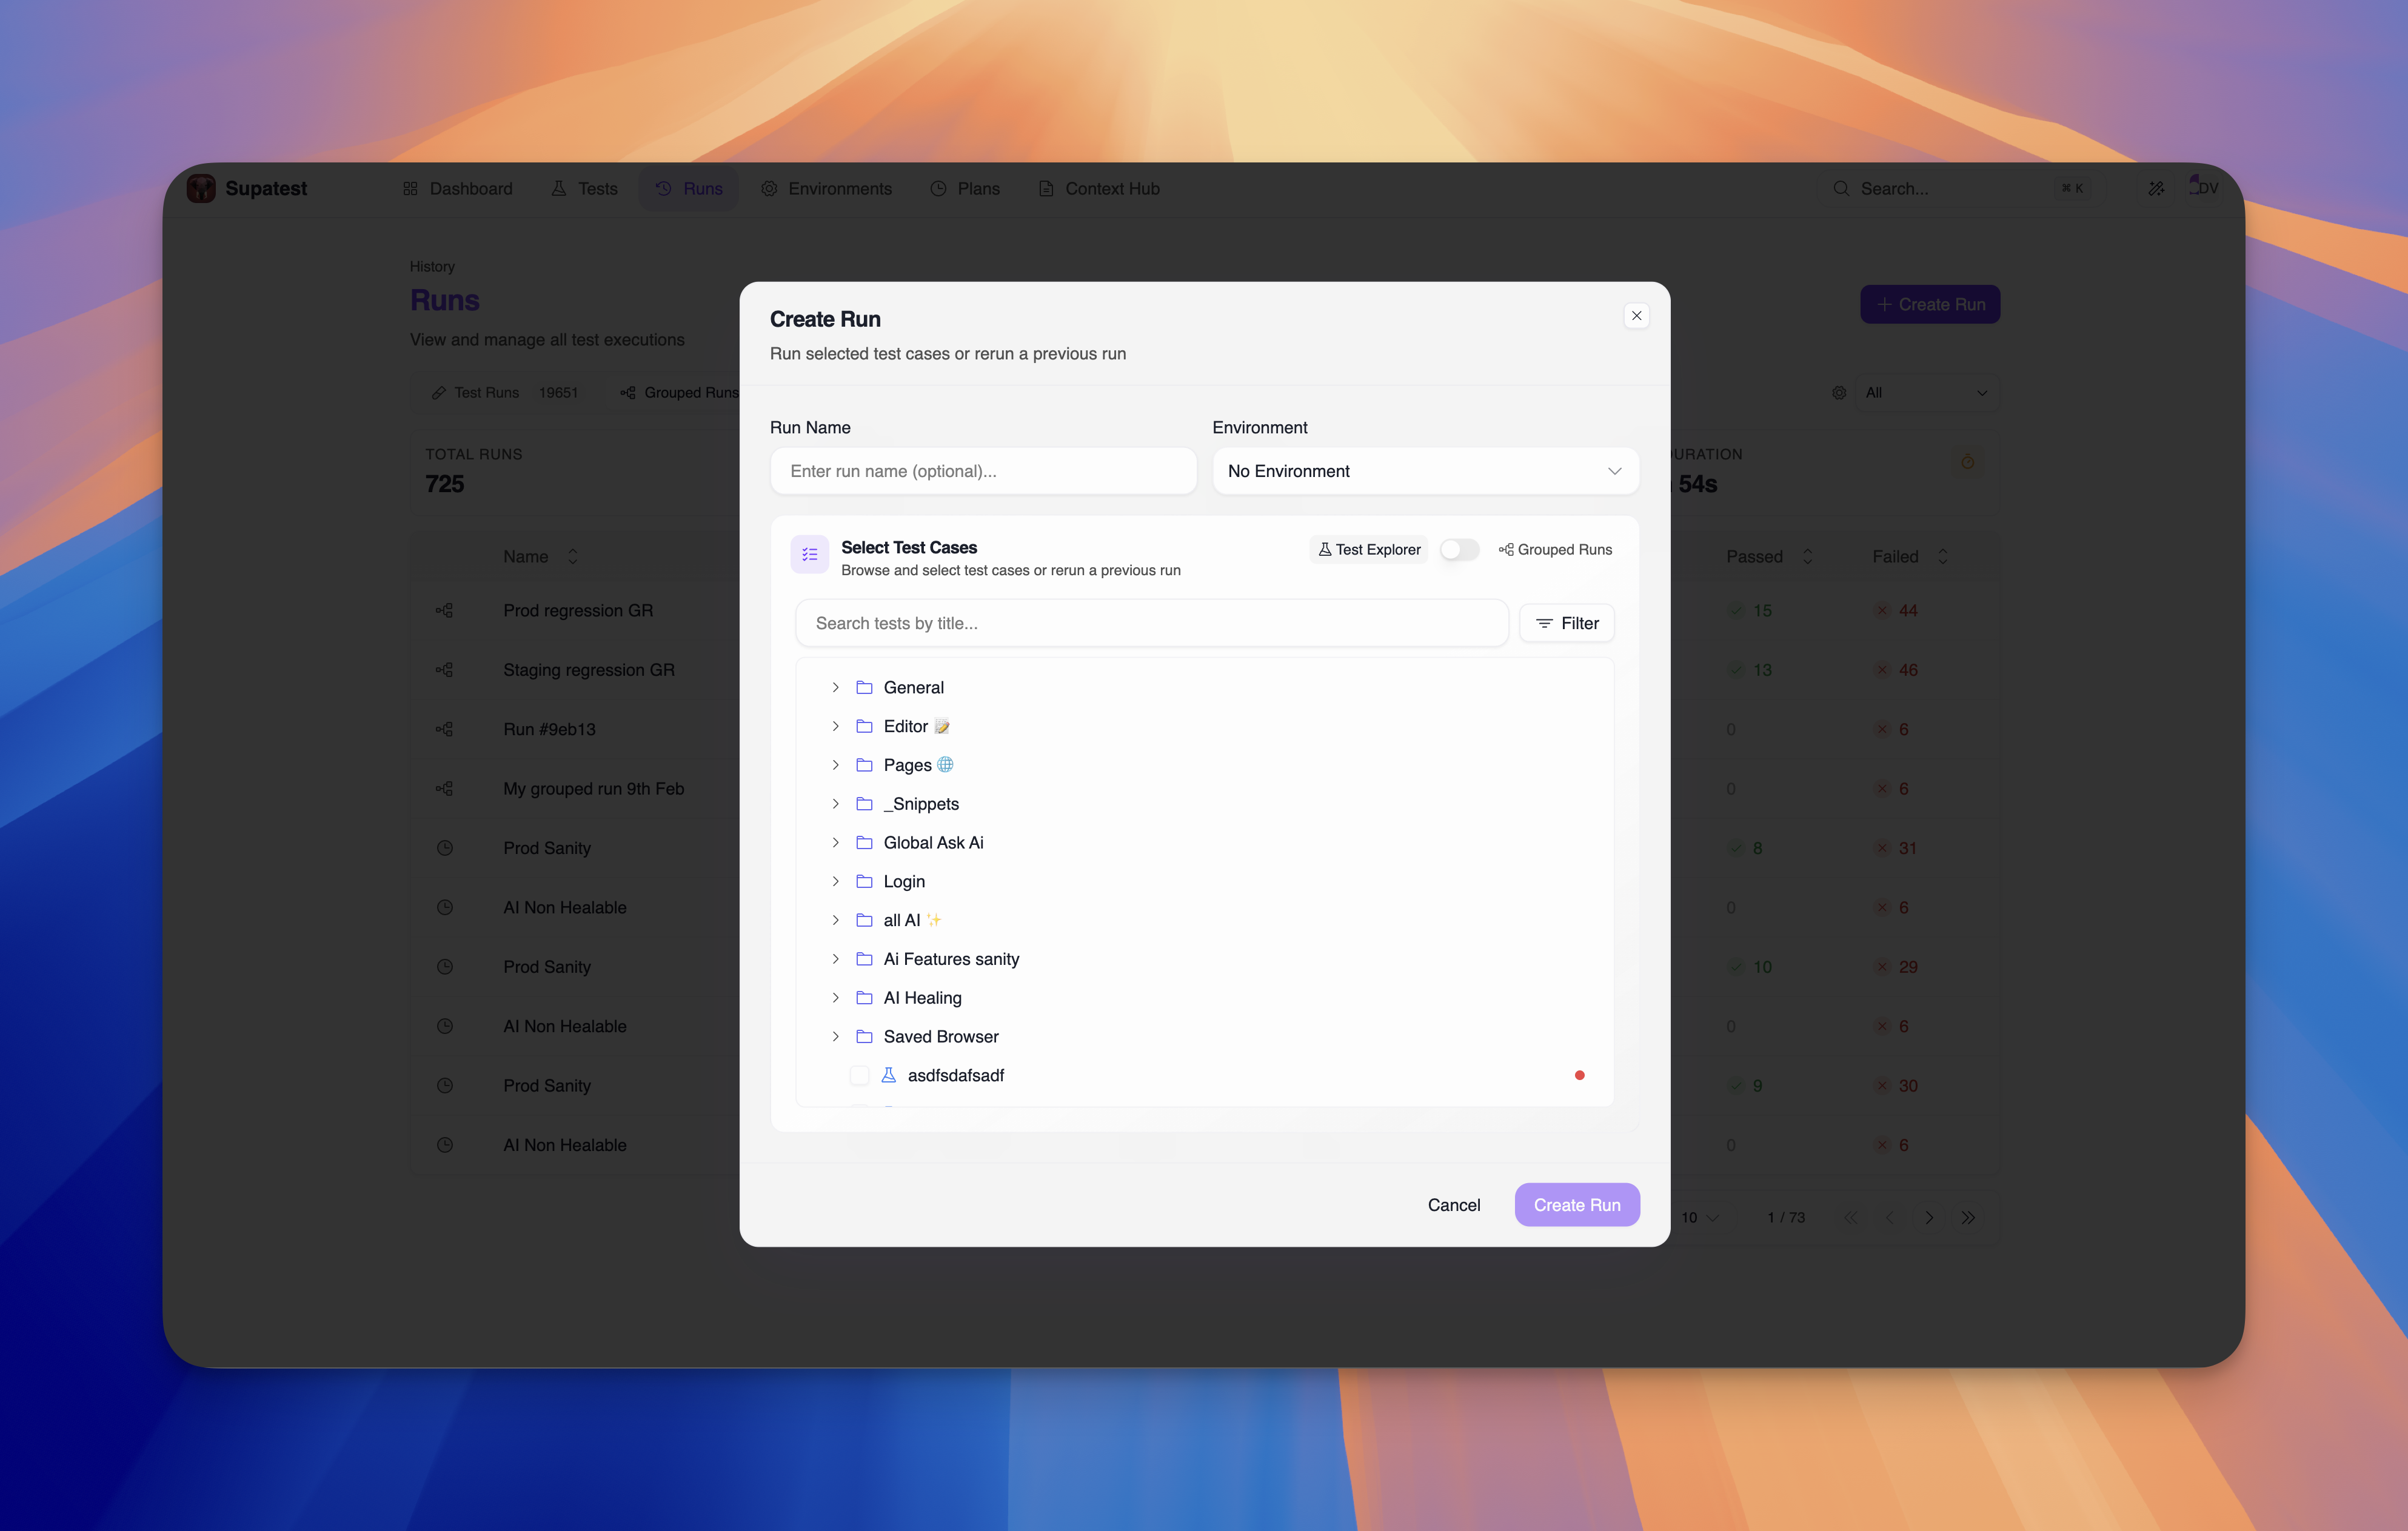
Run Settings
At the top of the dialog, configure the basic run settings:| Field | Description |
|---|---|
| Run Name | Optional name to identify this run (e.g., “Checkout regression”). If left blank, an auto-generated name is used. |
| Environment | Select which environment to run against, or leave as “No Environment”. |
| Run Configs | Optional. Select one or more run configs to apply to this run. If none are selected, each test uses its own attached run configs (or default config if none are attached). |
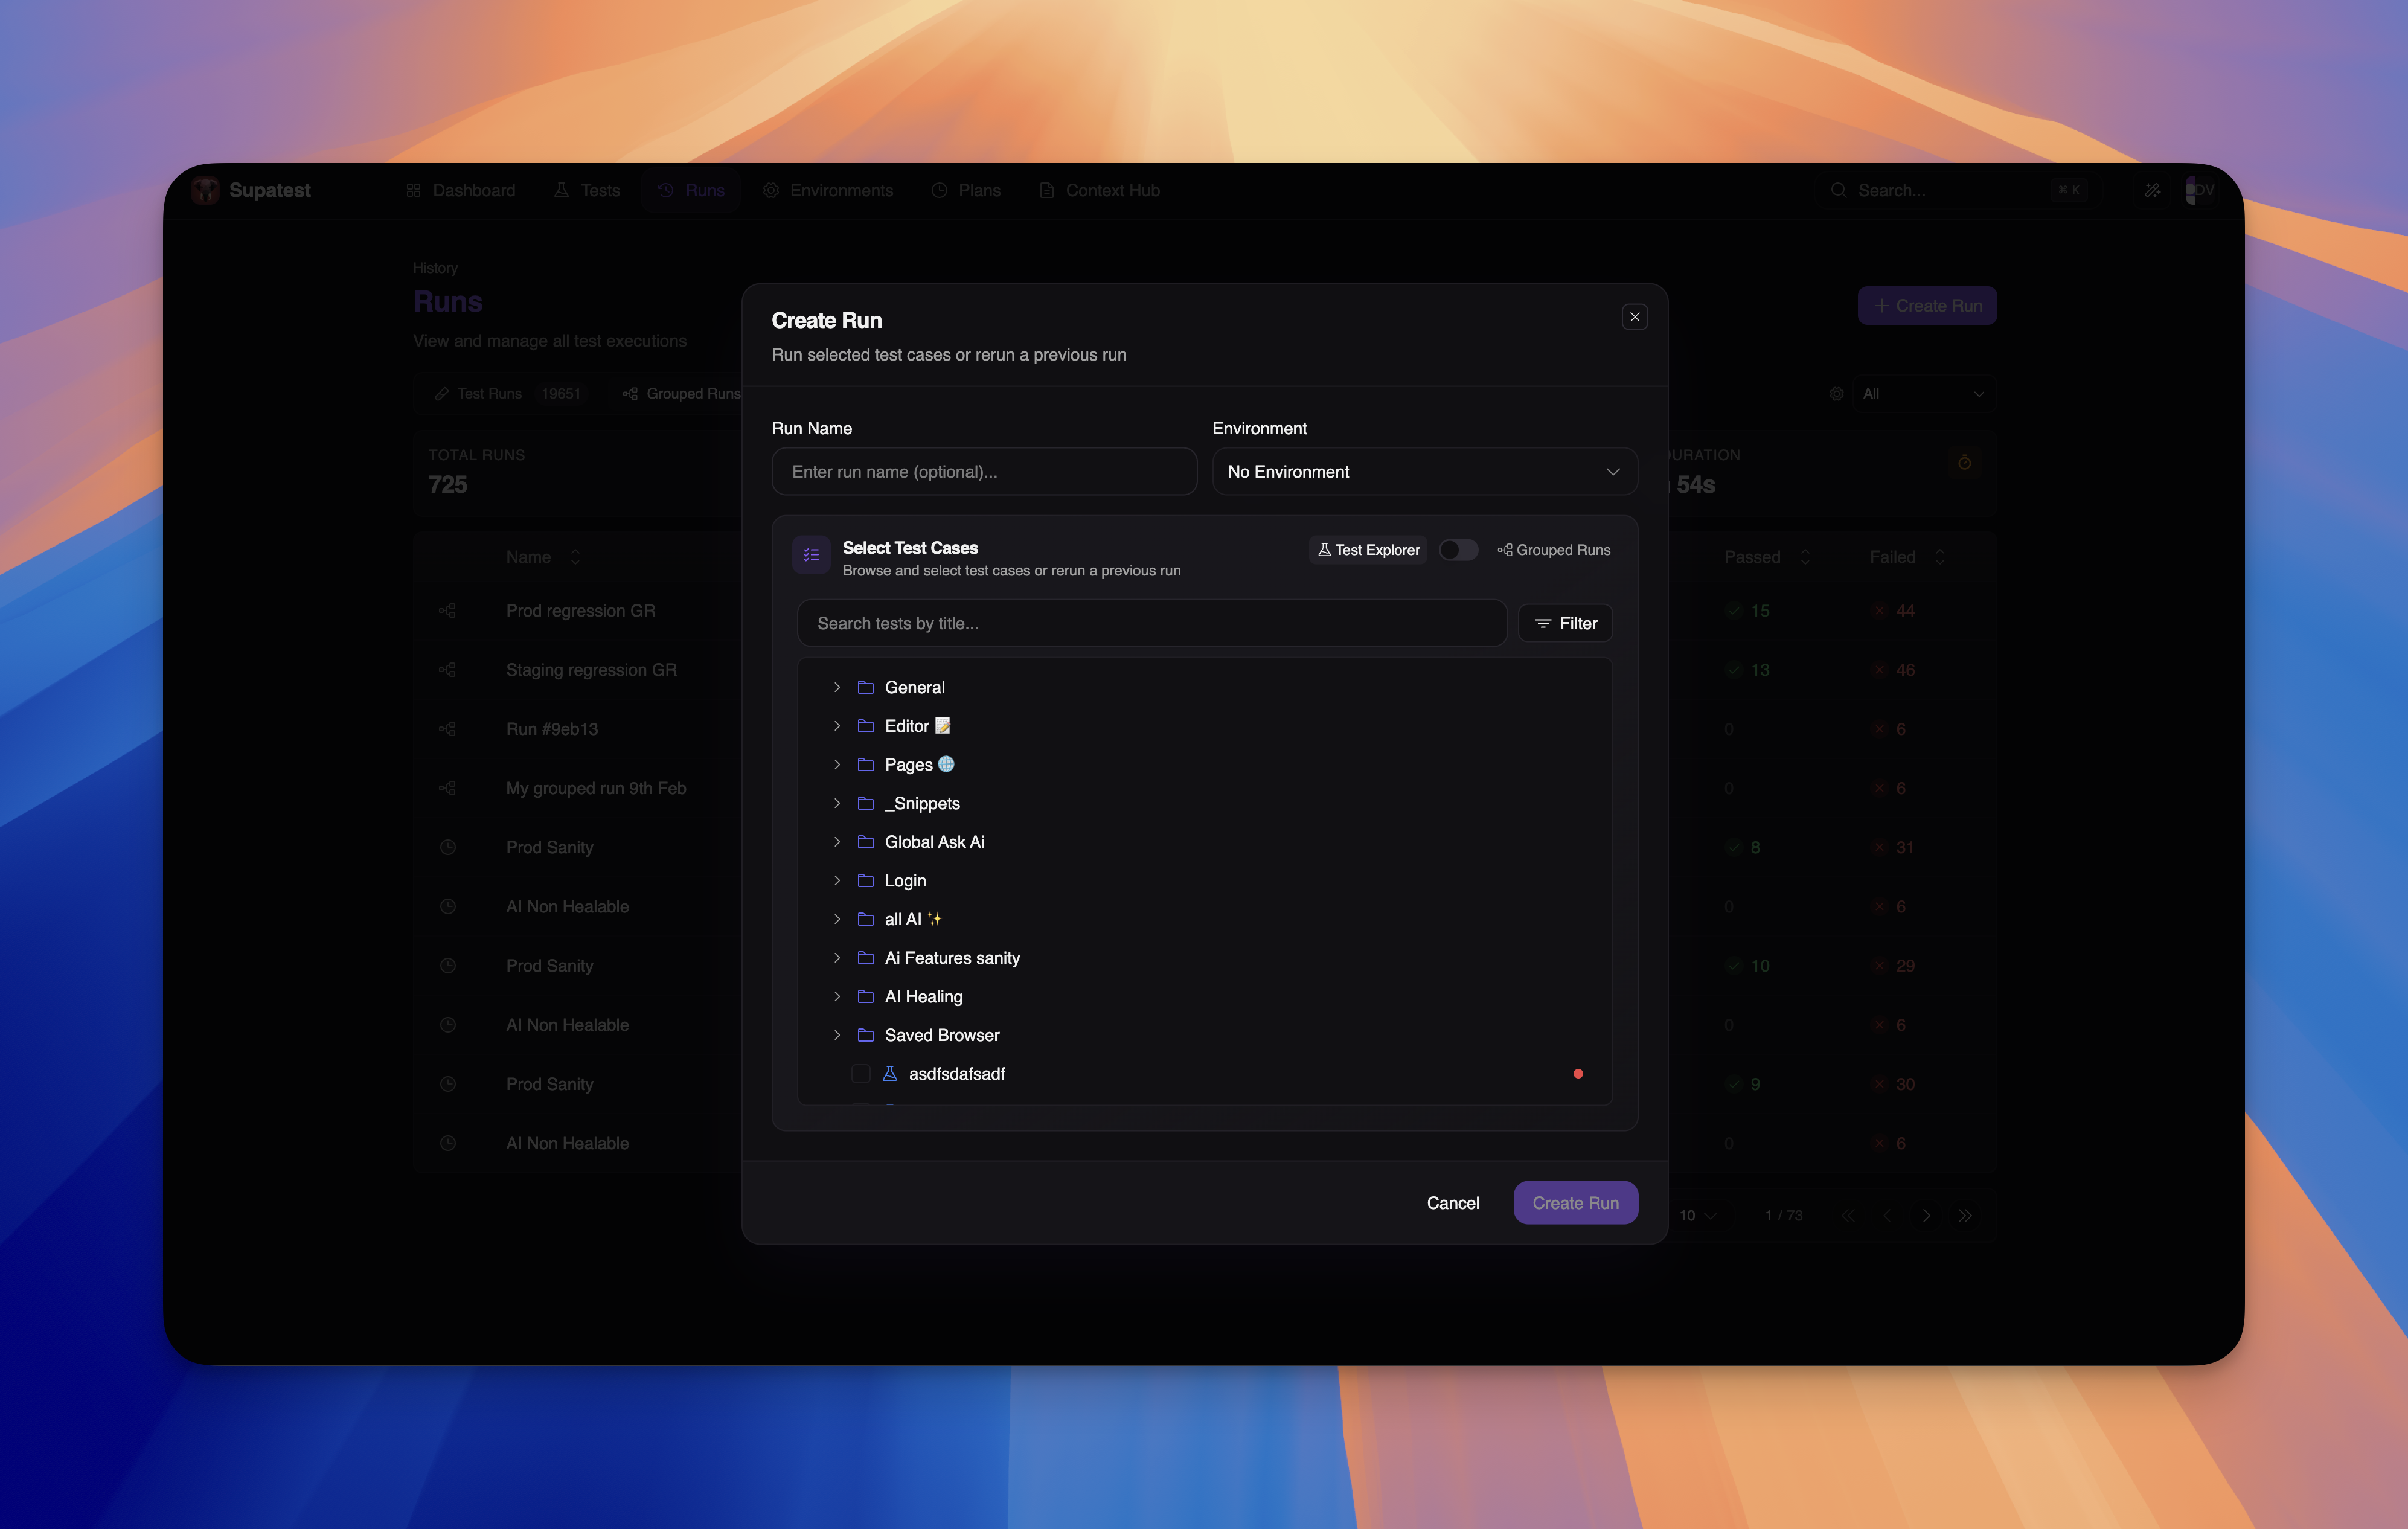
Selecting Test Cases
Below the run settings is the Select Test Cases section. A toggle switches between two selection modes:- Test Explorer - Browse your folder structure and pick tests
- Grouped Runs - Pick tests from previous runs
Test Explorer Mode
Test Explorer shows your test cases organized in the same folder structure you use in the Tests section. You can:- Expand folders to see nested test cases
- Search by test title using the search bar
- Filter by tags using the Filter button
- Select individual tests using checkboxes
- Select entire folders to include all tests within them
Grouped Runs Mode
Grouped Runs mode lists all your previous runs - both manually created runs and scheduled test plan runs. Each entry shows:- Run name and timestamp
- Trigger type (Manual / Scheduled)
- Environment badge
- Pass/fail counts with color indicators
| Button | What it does |
|---|---|
| Select All | Selects every test case from that run |
| Select Failed | Selects only the tests that failed - useful for rerunning failures after a fix |
| Clear | Clears the current selection from that run |
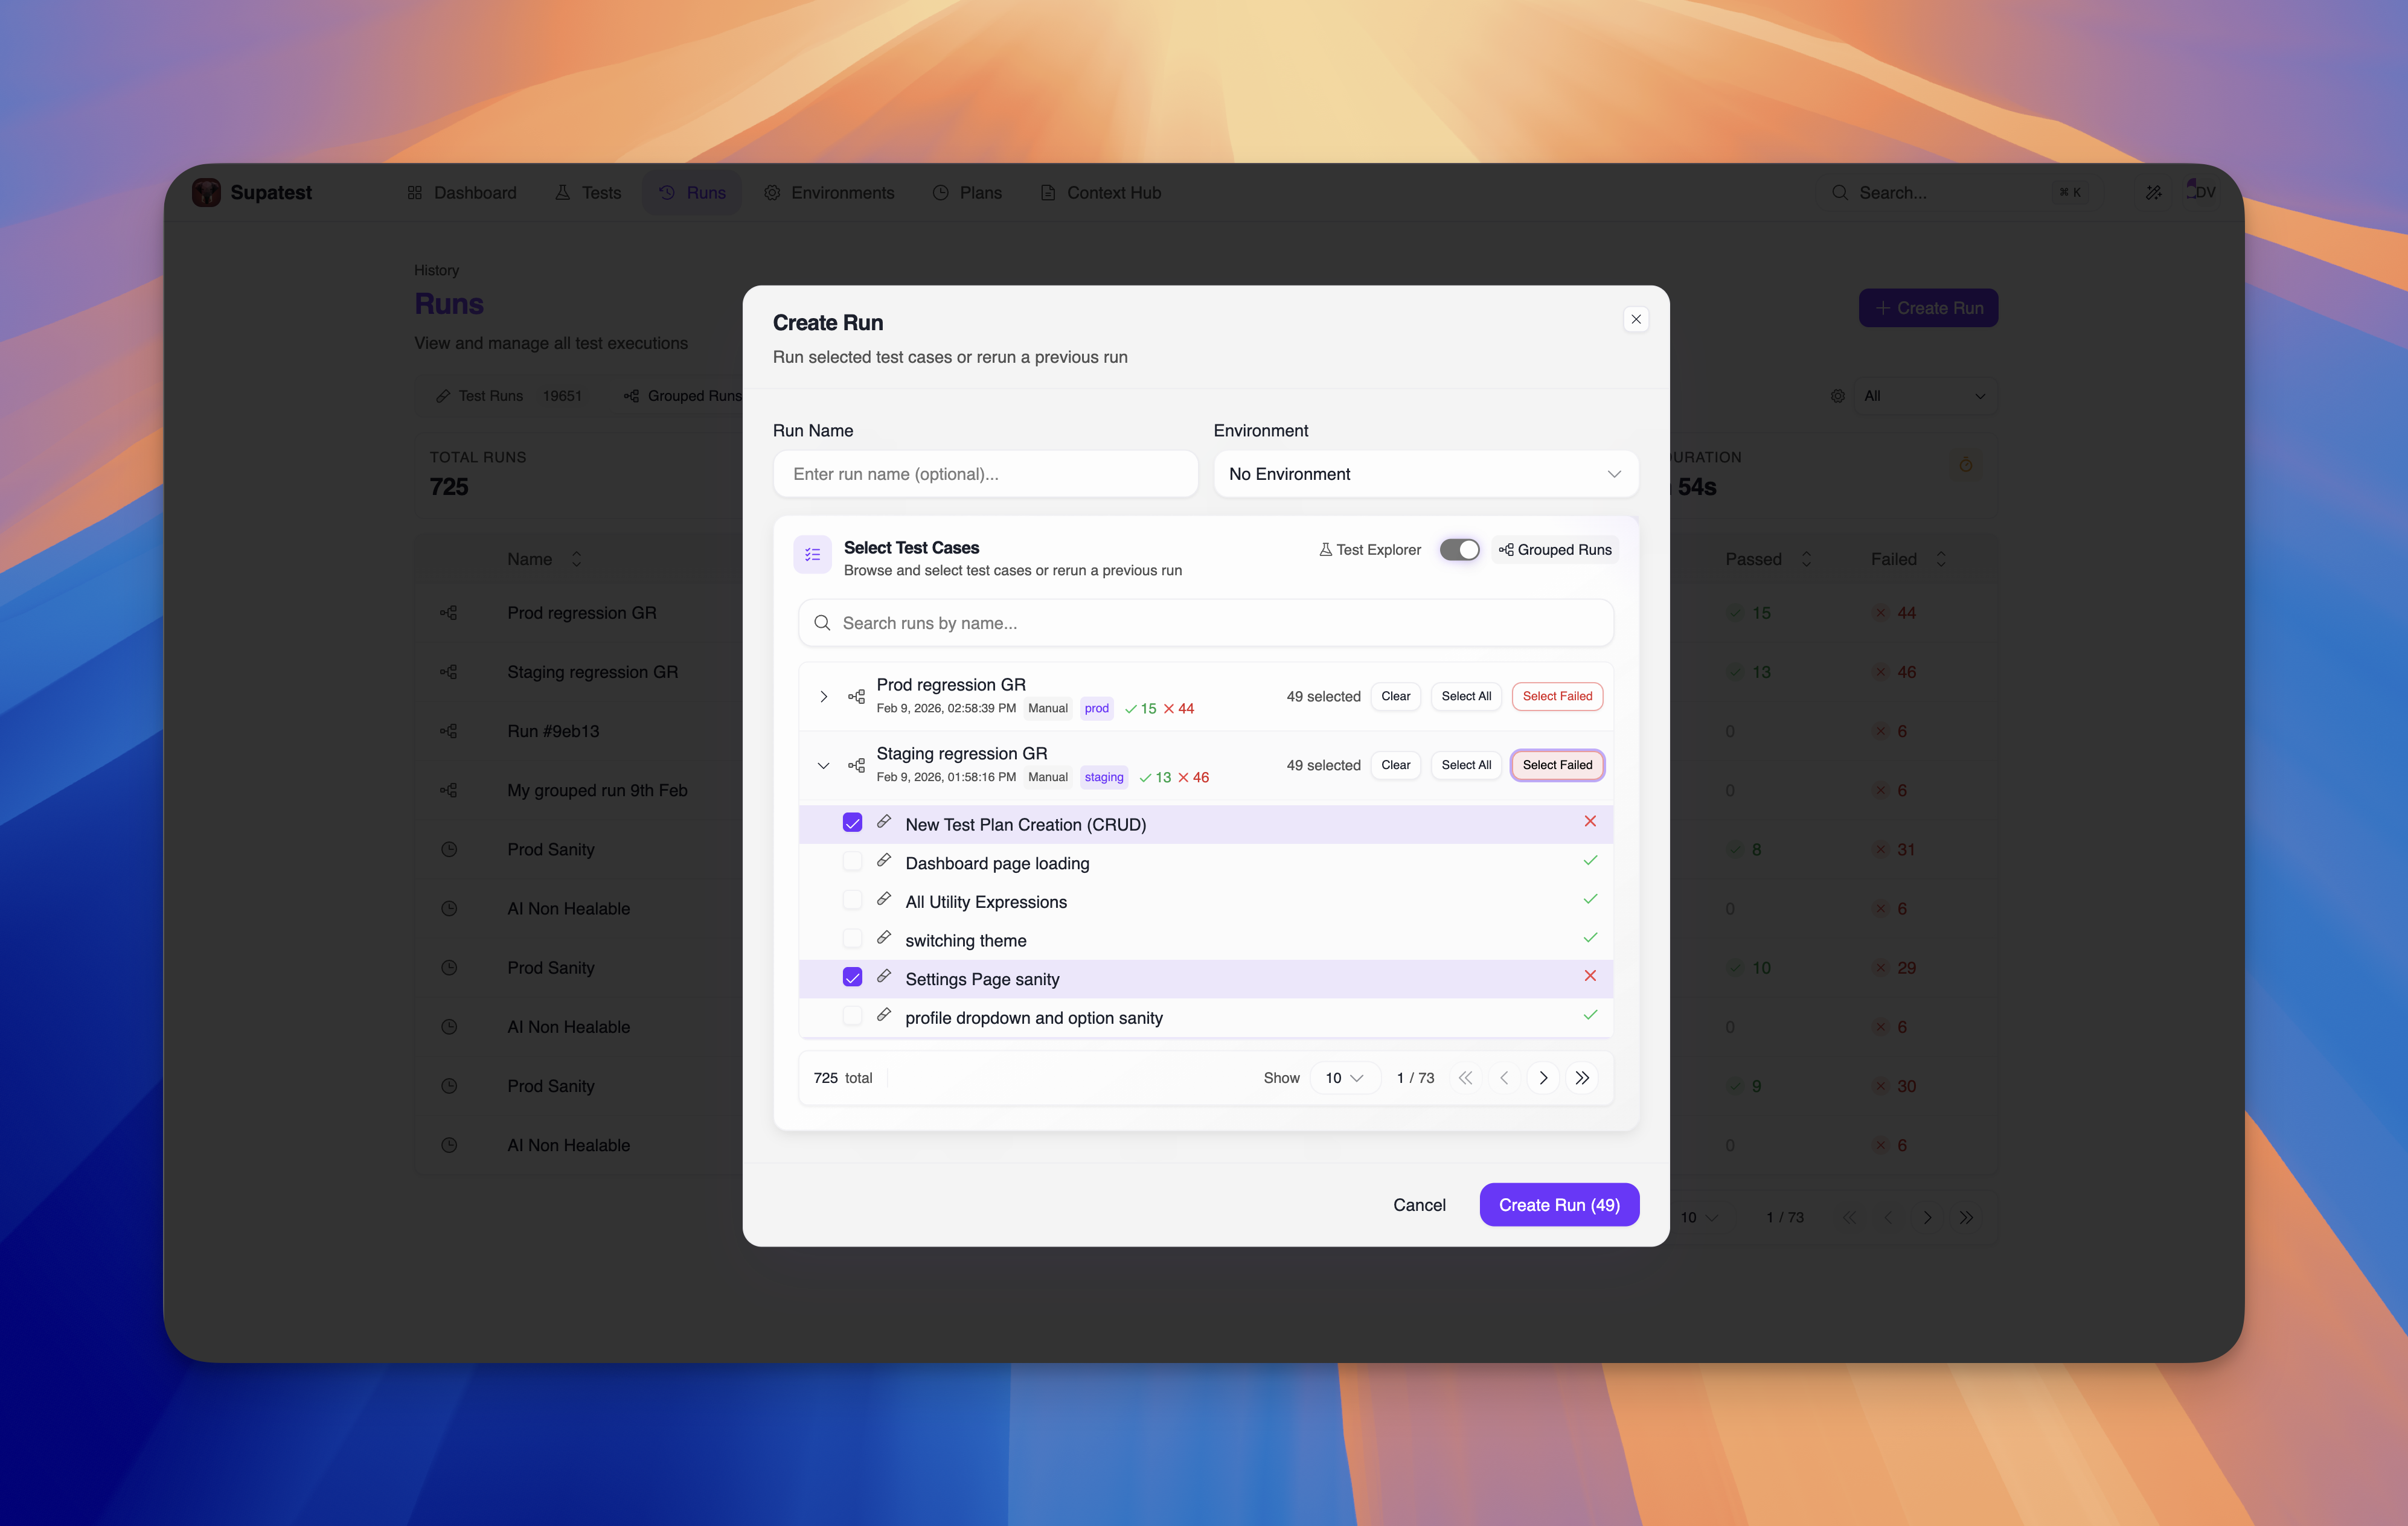
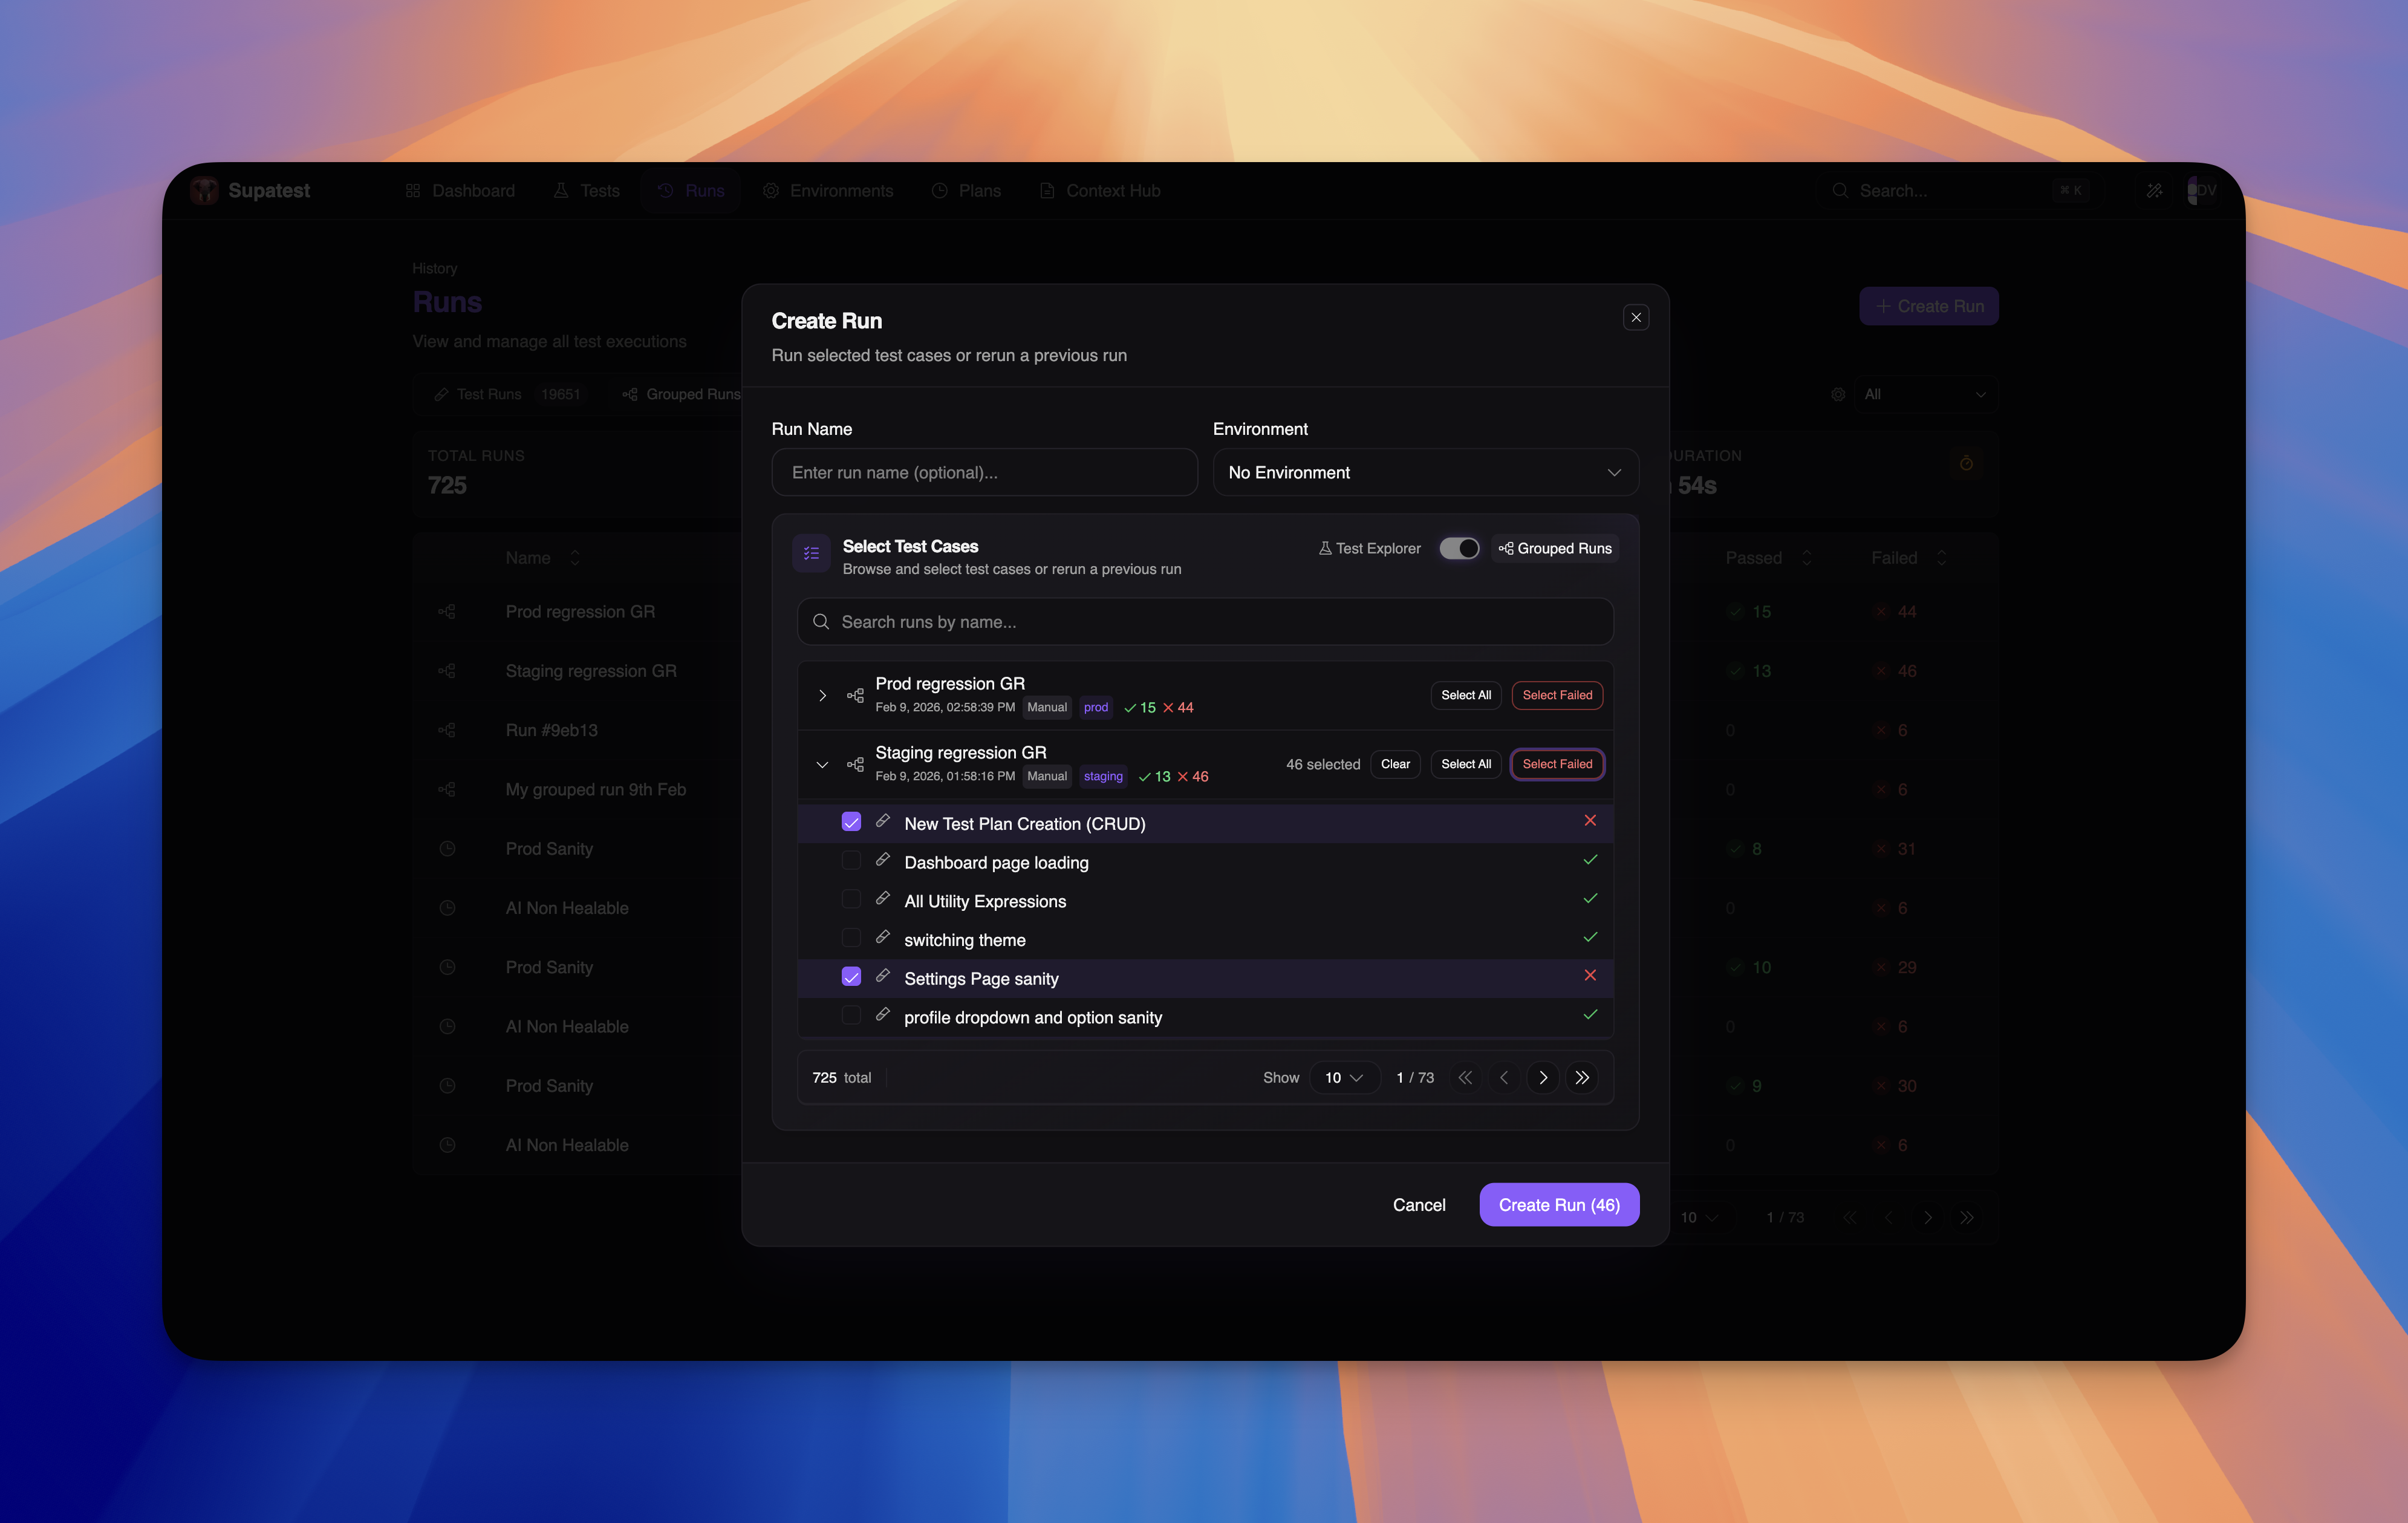
Launching the Run
Once you’ve selected your tests, the “Create Run” button shows the total count of selected tests (e.g., “Create Run (46)”). Click it to start execution. Tests are queued immediately and begin running in parallel based on your available workers. If you selected run configs, Supatest expands execution into a matrix:- selected test cases
- selected run configs
- browsers in each run config
- viewports in each run config
- enabled scenario rows (for table-driven tests)
Run Details
Click any row in the Grouped Runs table to open the run details page.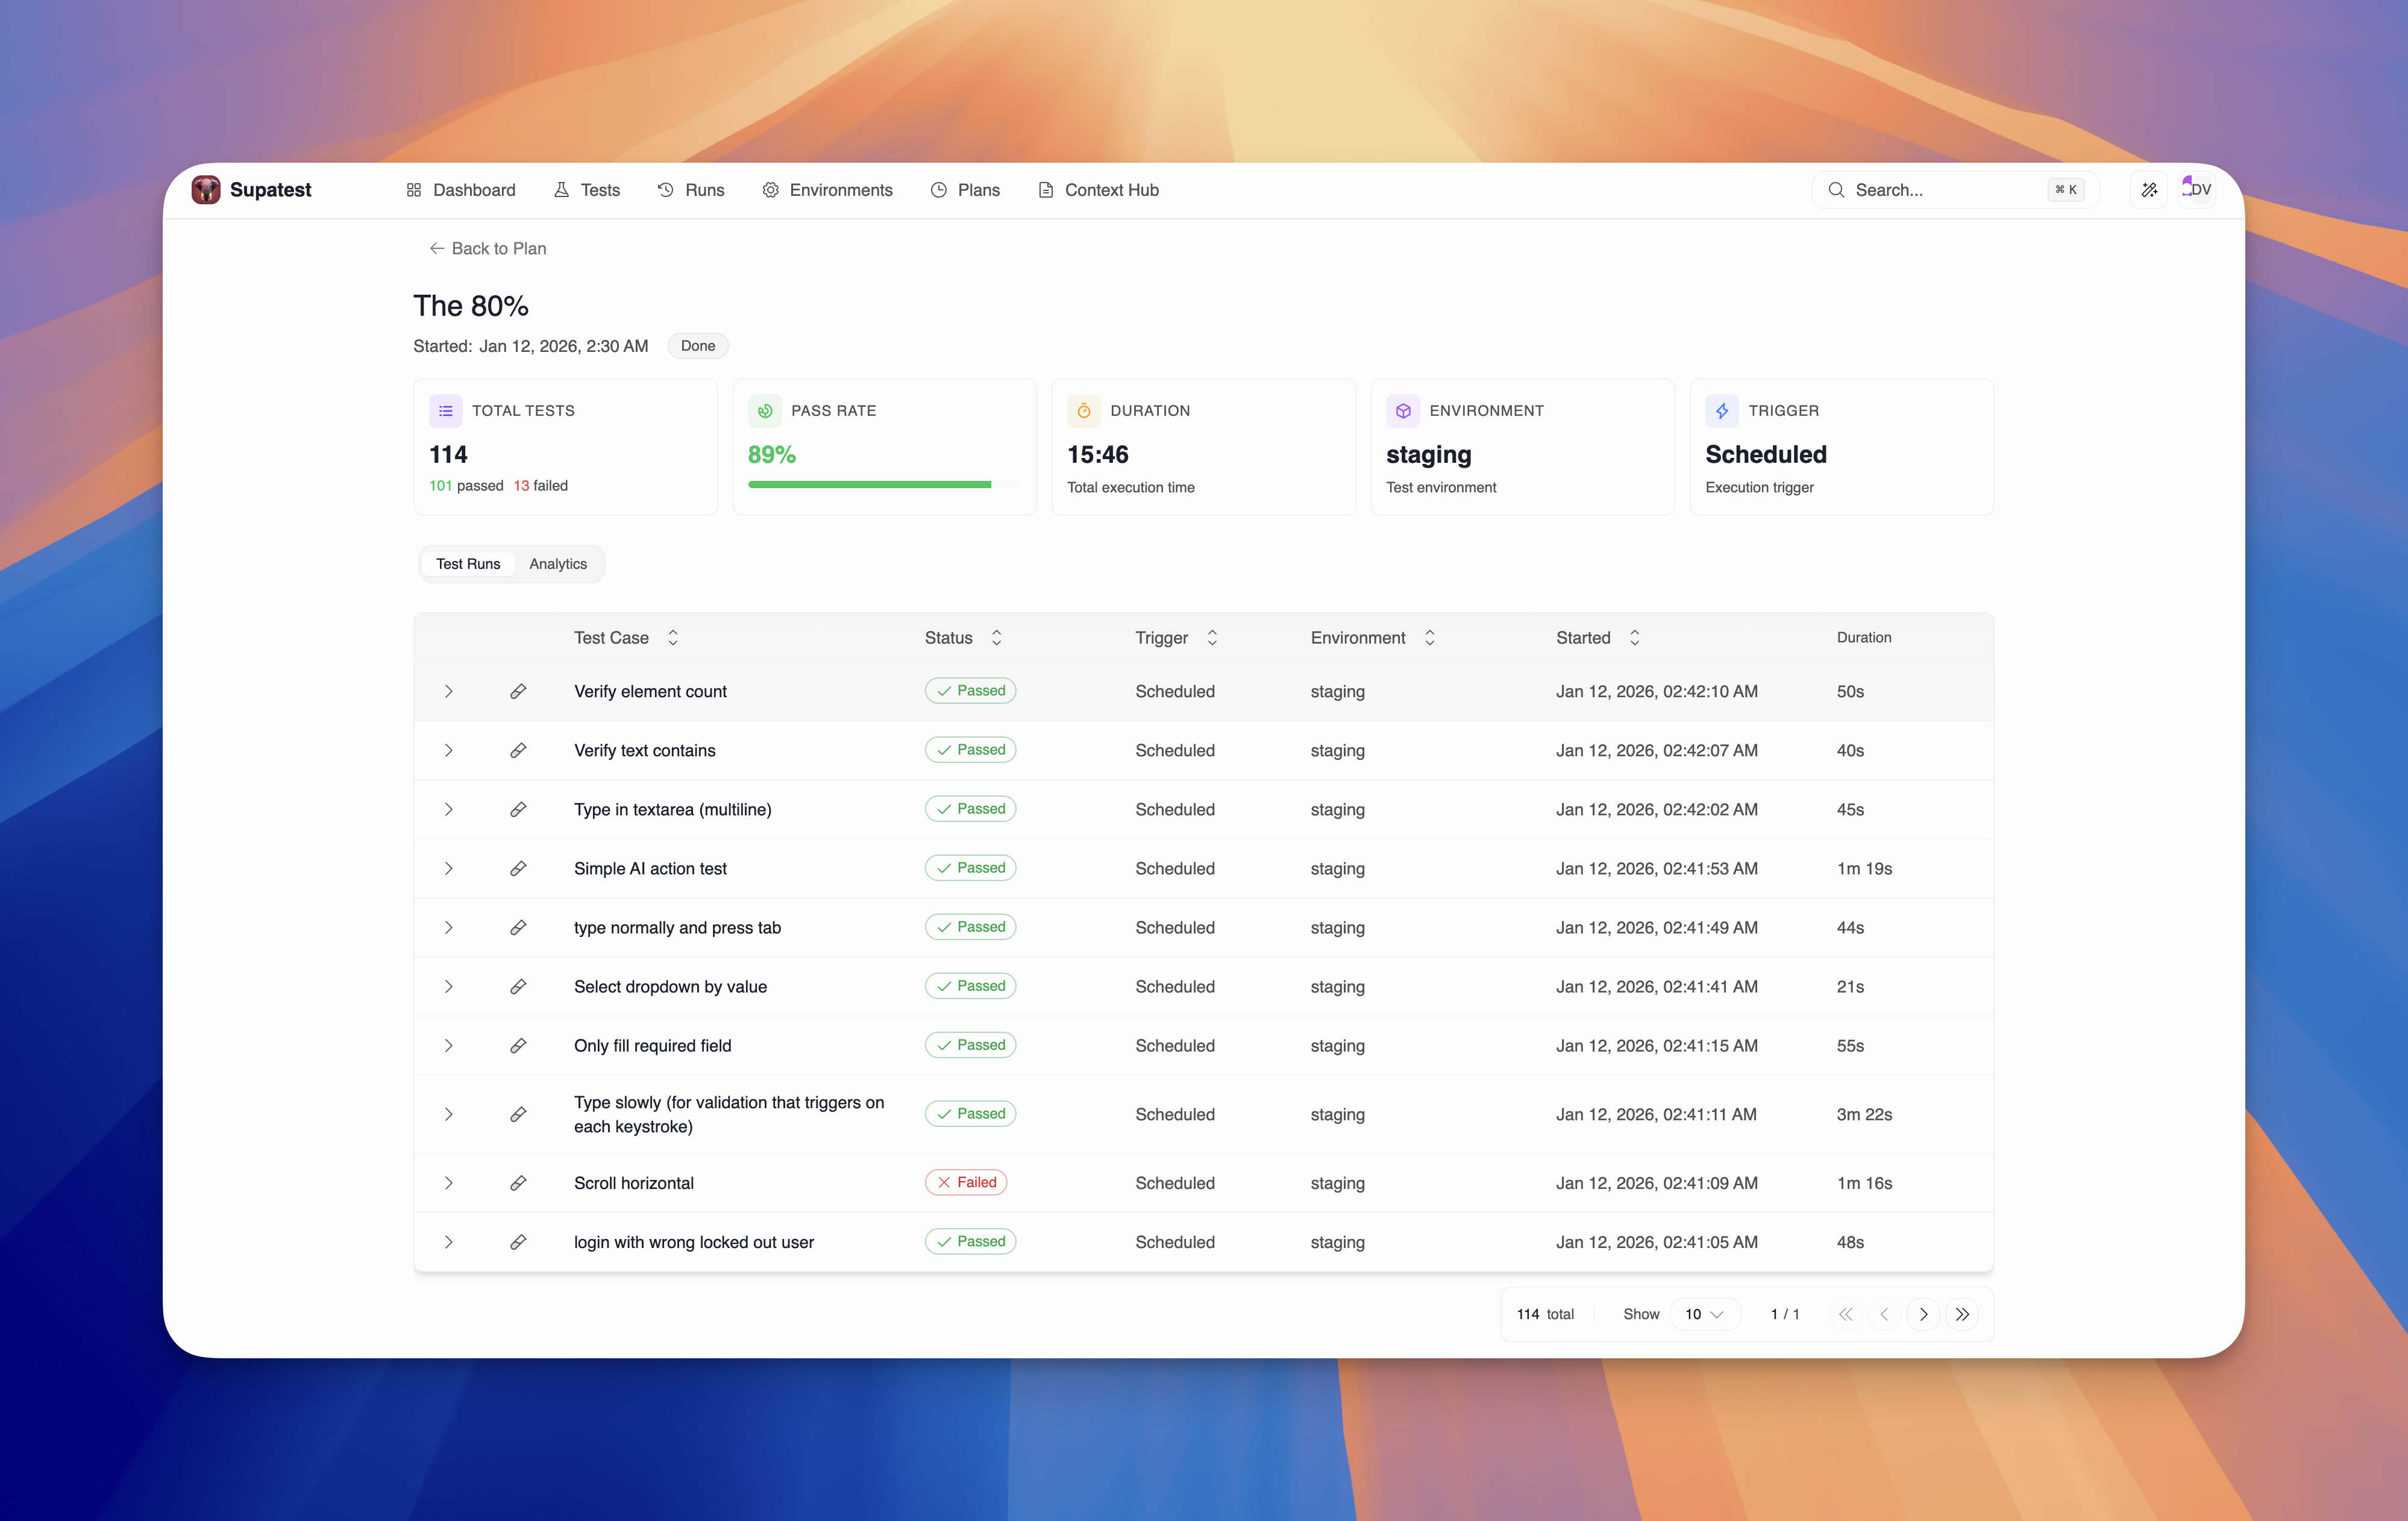
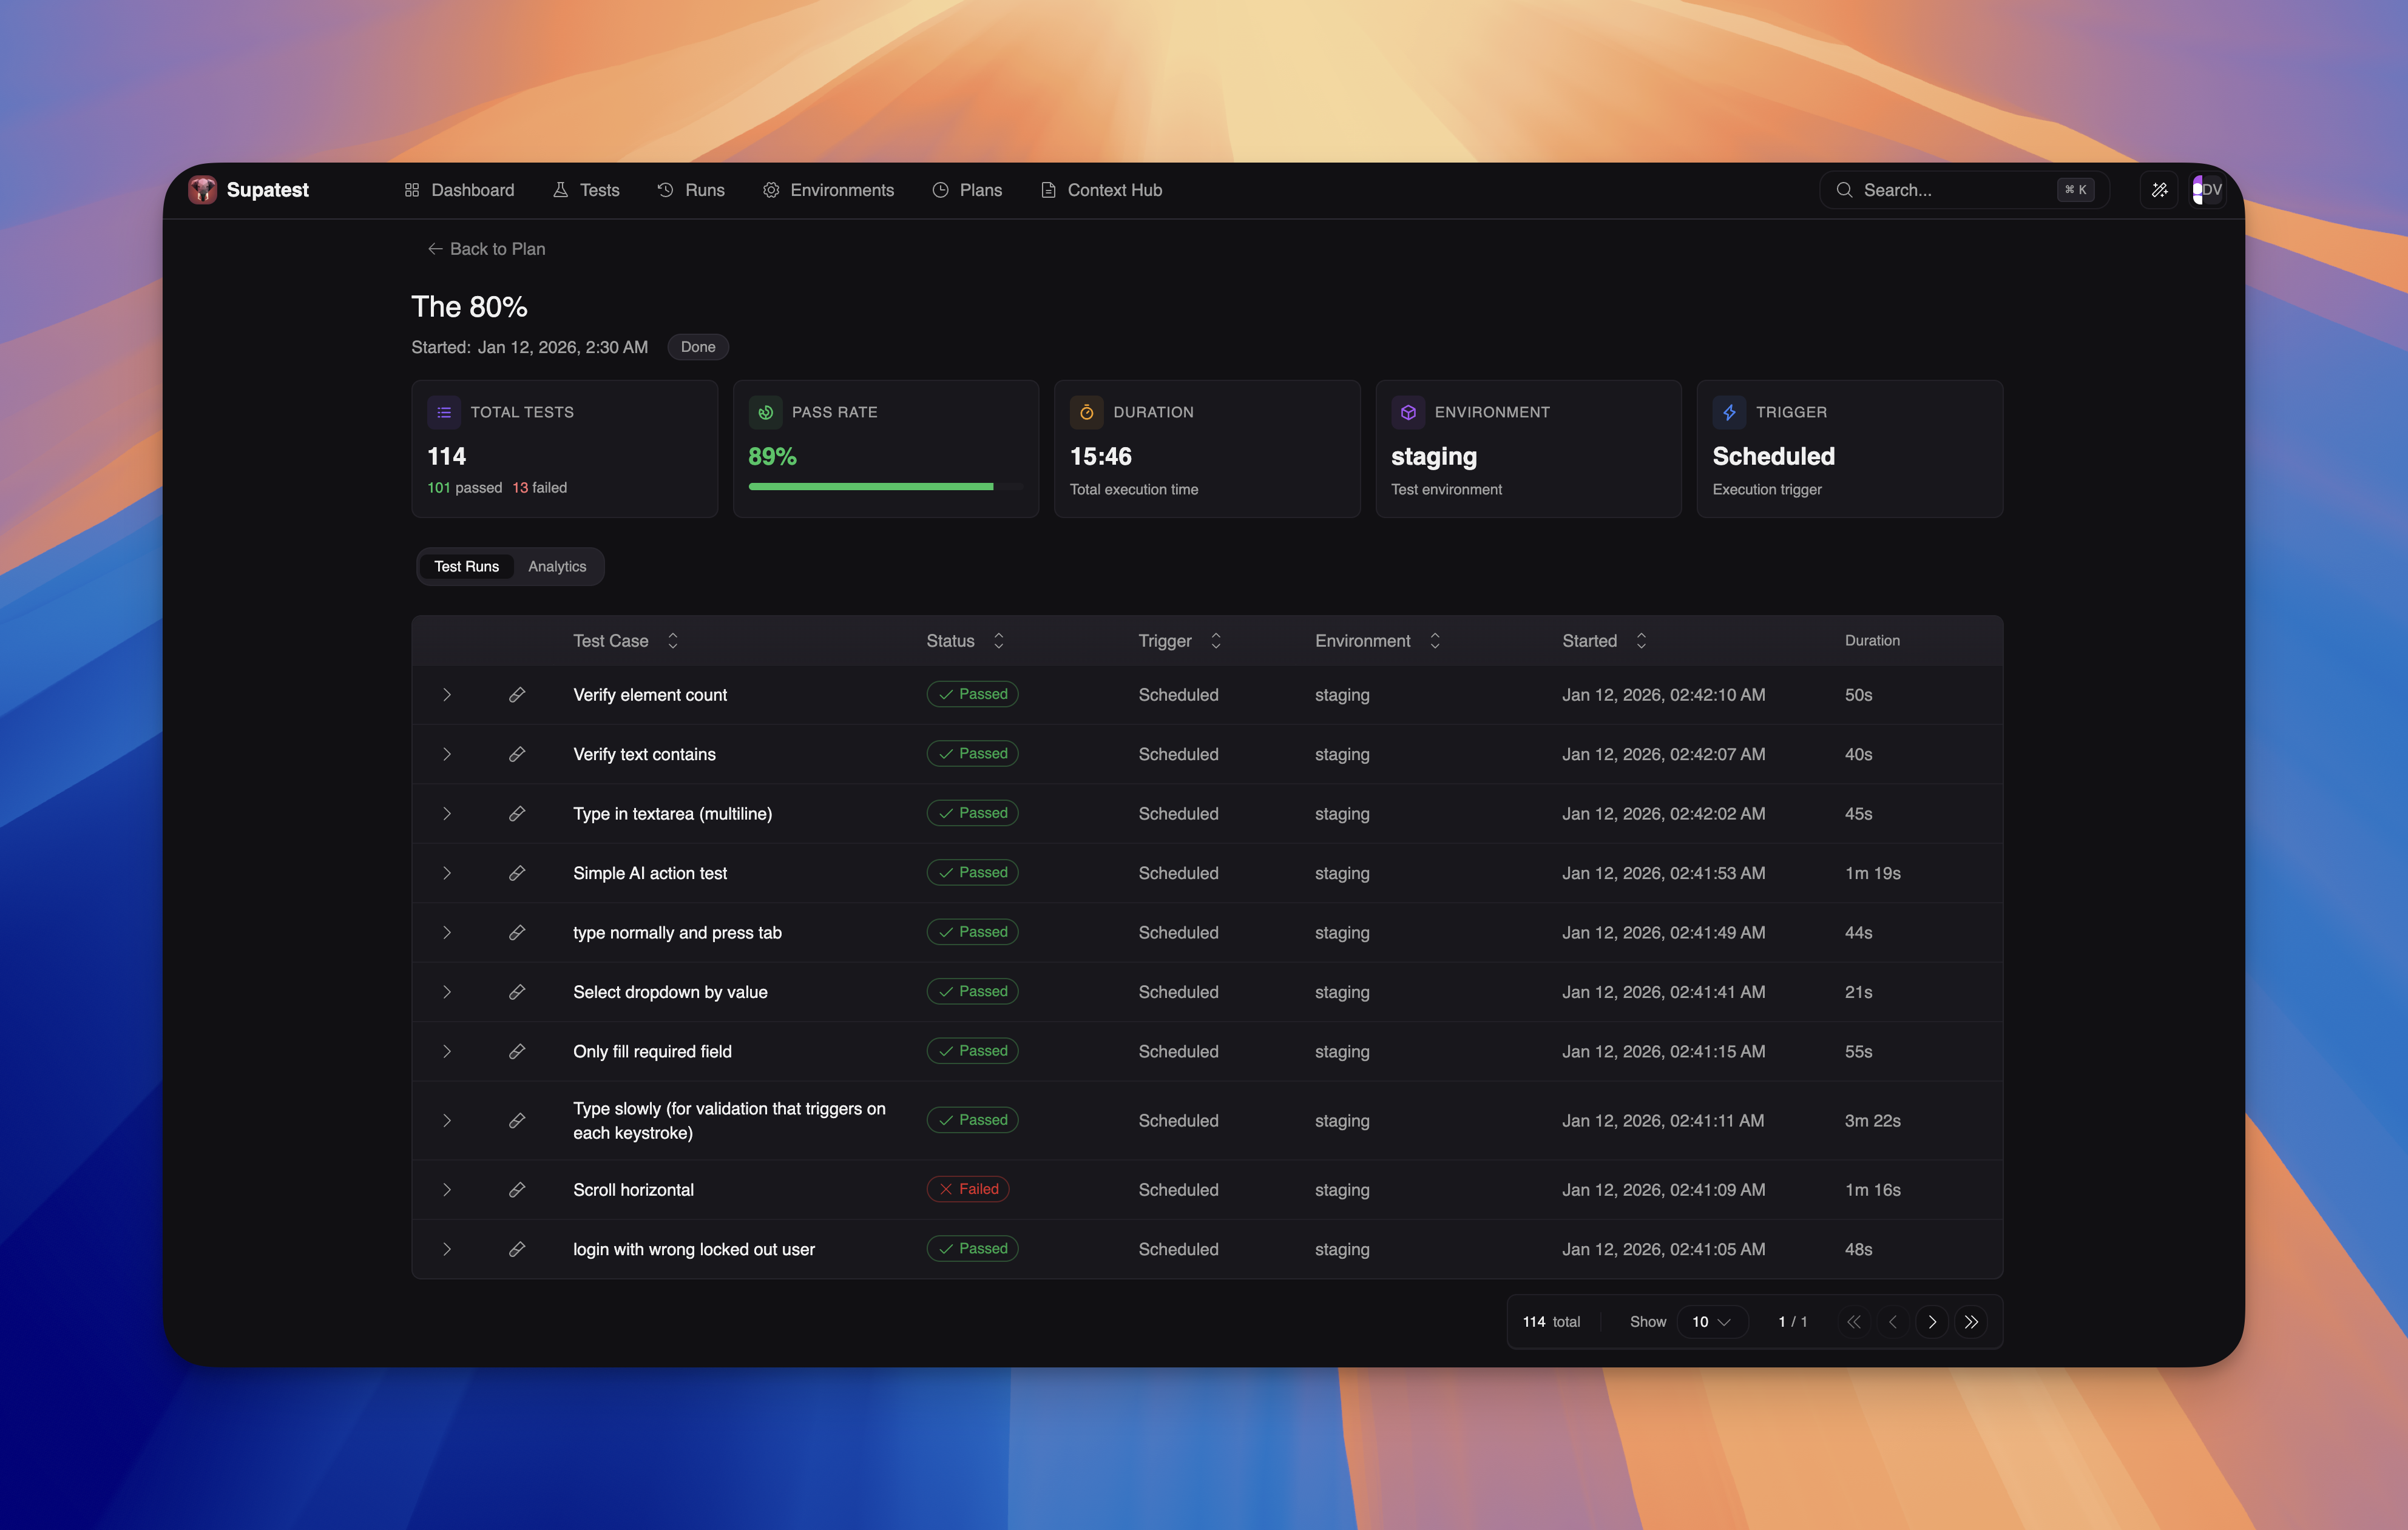
Summary Cards
Five cards at the top provide an at-a-glance overview:| Card | Description |
|---|---|
| Total Tests | Total count with passed/failed breakdown |
| Pass Rate | Percentage with visual progress bar |
| Duration | Total execution time |
| Environment | Which environment was used |
| Trigger | How the run was started (Manual or Scheduled) |
Test Runs Tab
The default tab lists every test case in the run with sortable columns: test case name, status, trigger, environment, start time, and duration. When a test executes as multiple runtime entries (for example from multiple run configs, browsers, viewports, or scenario rows), it appears as a grouped row. Expand it to inspect each concrete run with its run config, browser, viewport, status, and duration. Click any concrete run row to view detailed results including screenshots, video, and step-by-step trace.Analytics Tab
The Analytics tab provides deeper insights into the run’s results.
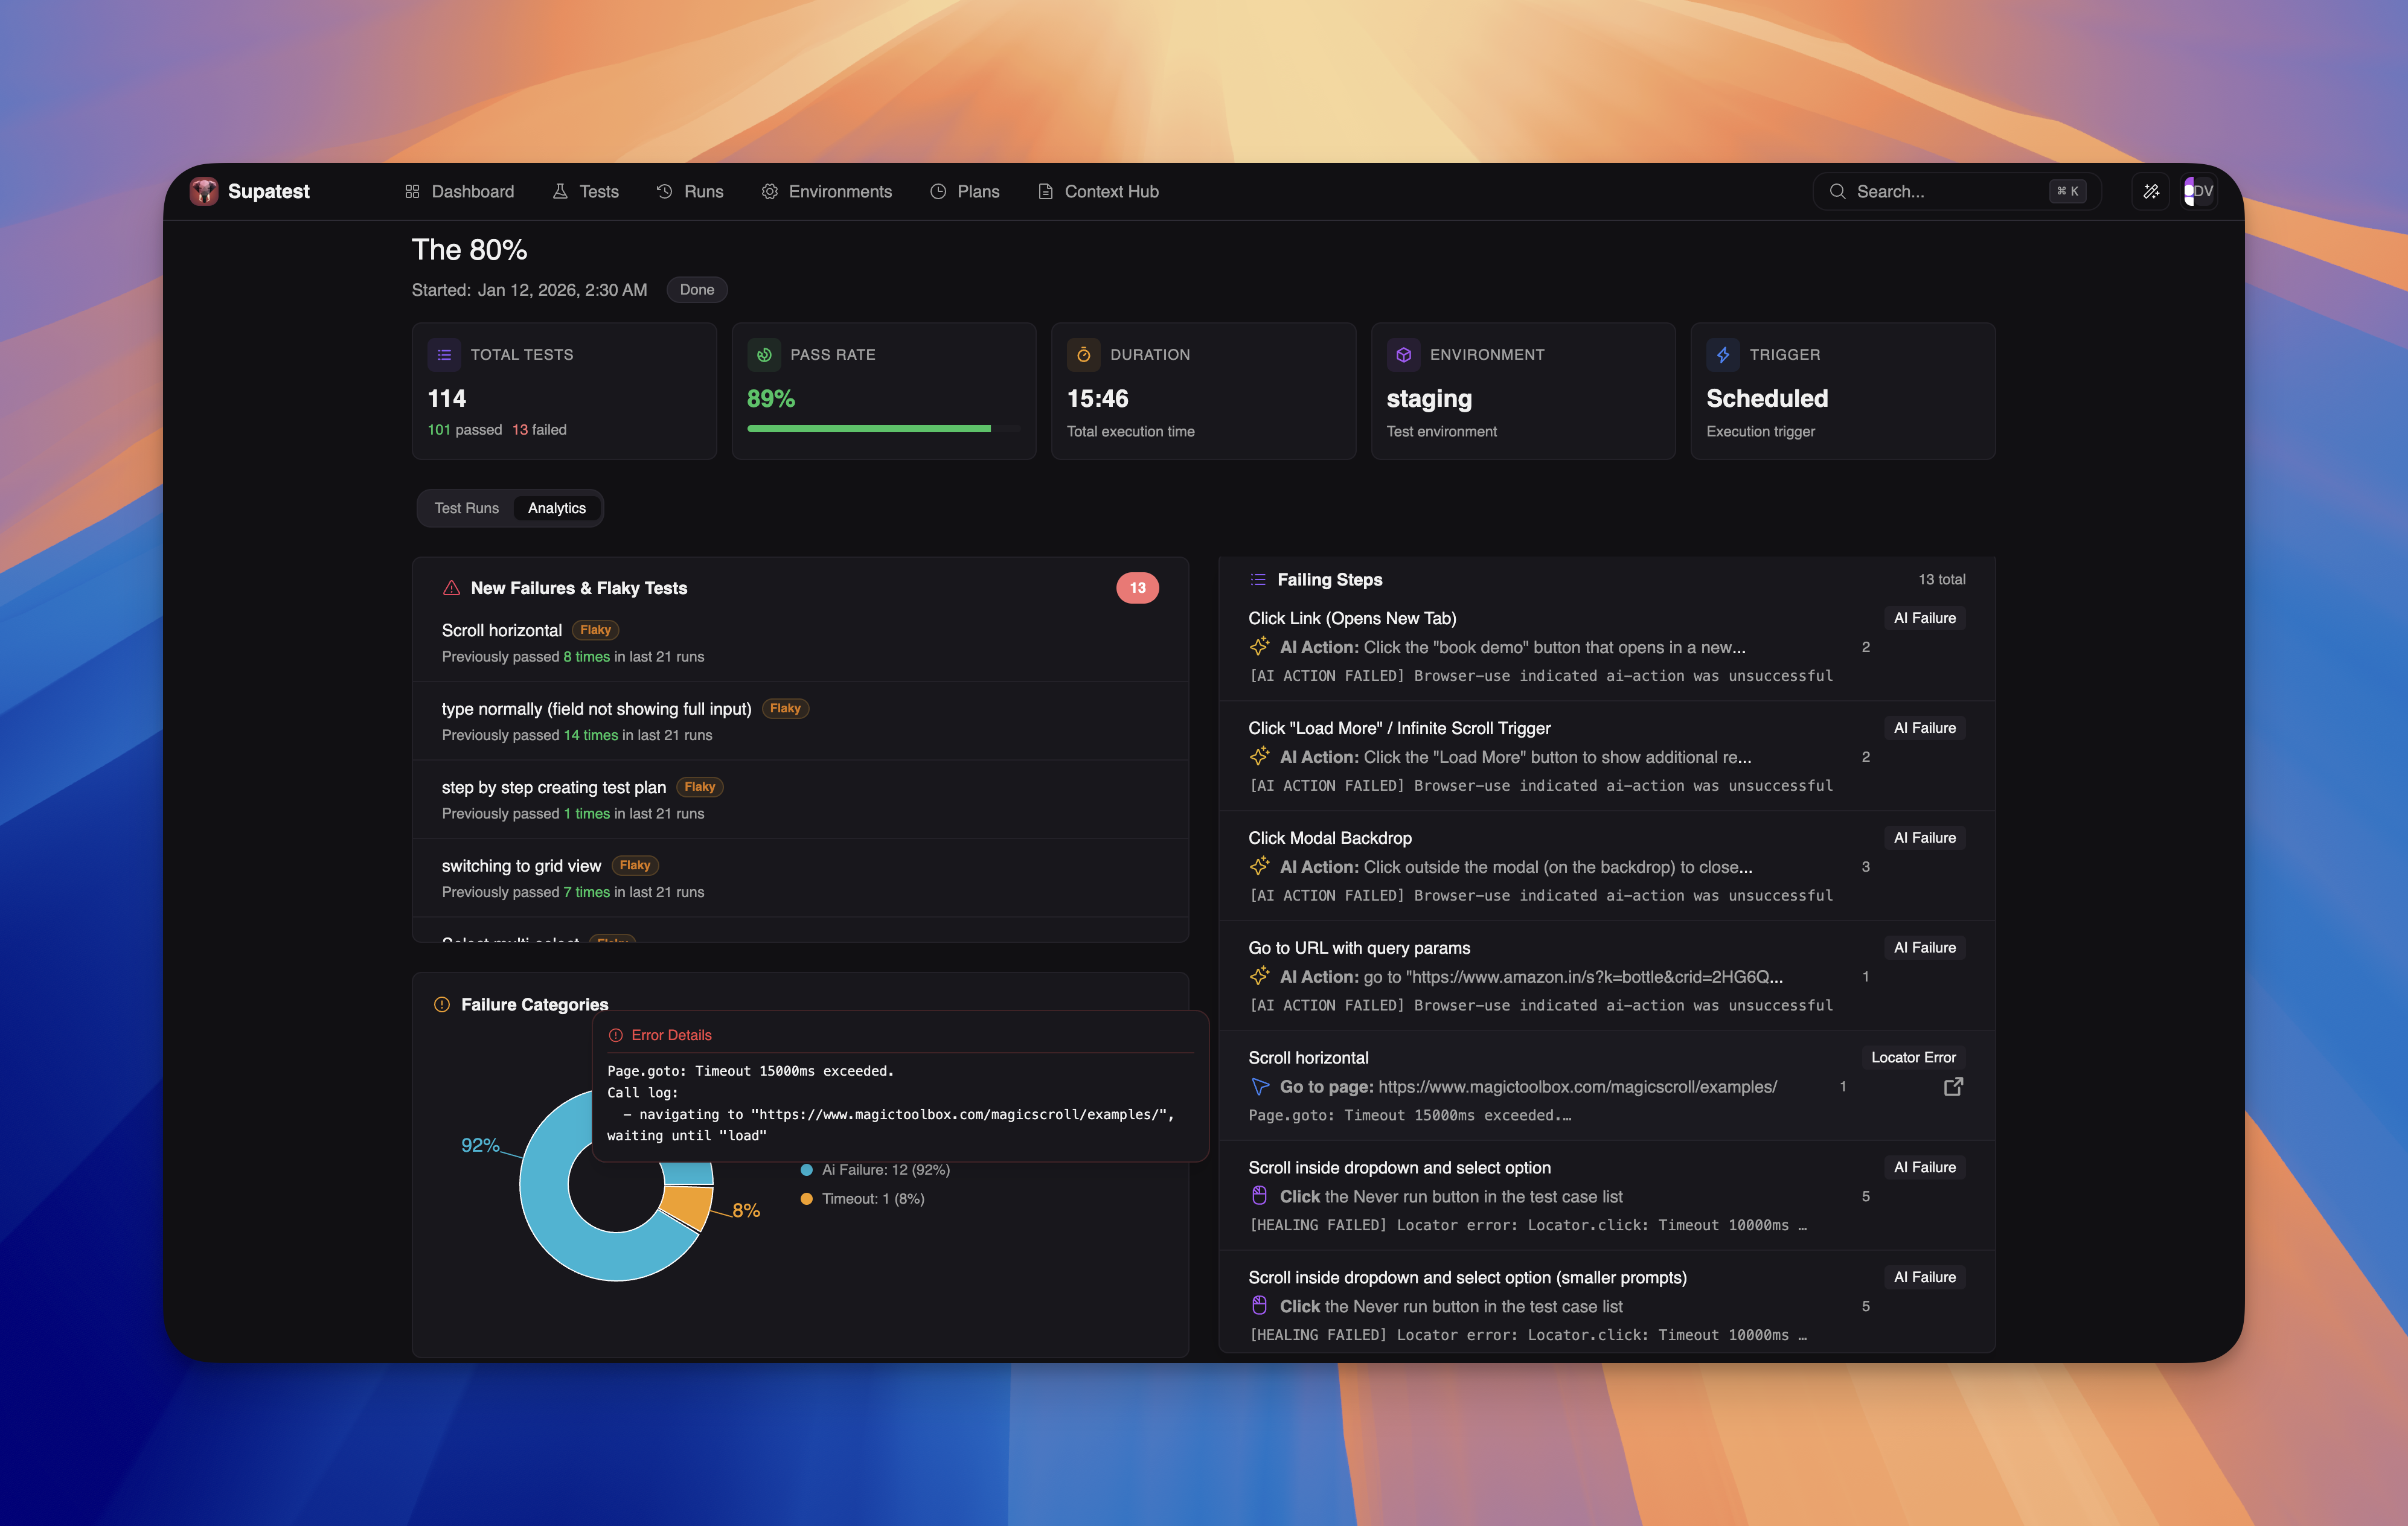
- New Failures & Flaky Tests - Tests that failed in this run but passed in previous runs. Each test shows how many times it previously passed, with a “Flaky” badge for inconsistent tests.
- Failure Categories - A donut chart showing the distribution of failure types (e.g., Locator Error, AI Failure, Assertion Failed, Timeout). Helps you identify systemic issues at a glance.
- Failing Steps - A scrollable list of every failing step across all test cases. Each entry shows the step action, the error message, the failure category, and how many times that step failed. This is where you go to understand what exactly is breaking.
Related
Test Plans
Schedule automated test runs
Parallel Execution
Run tests concurrently for faster results
Debugging Tests
Analyze and fix failing tests
Environments
Configure test environments